Difference between revisions of "SOCR HTML5 Expansion MotionCharts"
(→Social networking/sharing) |
|||
| Line 30: | Line 30: | ||
This unique URL motion-chart play format uses the following components: | This unique URL motion-chart play format uses the following components: | ||
* Main Applet URL: ''http://SOCR.ucla.edu/htmls/HTML5/MotionChart/'' | * Main Applet URL: ''http://SOCR.ucla.edu/htmls/HTML5/MotionChart/'' | ||
| − | * PHP script that harvests the tabular data from URL: [[ | + | * PHP script that harvests the tabular data from URL: [[File:Jnlp_writer_php.zip|MotionChart.php]] |
* Reference to an online Dataset (tabular format required): ''?http://wiki.stat.ucla.edu/socr/index.php/SOCR_Data_Dinov_010309_HousingPriceIndex'' | * Reference to an online Dataset (tabular format required): ''?http://wiki.stat.ucla.edu/socr/index.php/SOCR_Data_Dinov_010309_HousingPriceIndex'' | ||
* Variable Mapping Syntax: ''&key=year&x=HPI&y=UR&size=pop&color=region&category=State'' | * Variable Mapping Syntax: ''&key=year&x=HPI&y=UR&size=pop&color=region&category=State'' | ||
Revision as of 18:54, 9 August 2012
Contents
SOCR Project - SOCR HTML5 Expansion of the MotionCharts Project
Background
The amount, complexity and provenance of data have dramatically increased in the past five years. Visualization of observed and simulated data is a critical component of any social, environmental, biomedical or scientific quest. The SOCR MotionCharts provide an interactive infrastructure for discovery-based exploratory analysis of multivariate data. This dynamic data visualization tool enables the displaying of high-dimensional longitudinal data. SOCR Motion Charts allows mapping of ordinal, nominal and quantitative variables onto time, 2D axes, size, colors, glyphs and appearance characteristics, which facilitates the interactive display of multidimensional data.
Project goals
The goal of this project is to redesign the Java-based SOCR_MotionCharts applet using only HTML5, CSS3 and JavaScript, and in the process introduce some useful and powerful expansions of this web-app.
Project specification
The HTML5/JavaScript implementation of the new SOCR MotionCharts Web-App es expected to lower the device and software barriers for users. There are three specific extensions to the Motion Charts application that are necessary in this redesign process
- The first extension/improvement provides better color handling for data that are not uniformly distributed. The proposed solution requires the use of a percentile or quantile subdivision of data intensities. Given a data set , the current color indexing calculations would assign too many colors to empty spaces, and too few to the actual clusters of data. While we could simply create a color map of all possible color values, the problem would still exist with data that have large ranges and it would be incredibly memory inefficient. A quantile-based color index would assign more colors to areas of greater data density and fewer colors to areas of lesser data density, reducing the size of the color map and providing distinct colors to more points. Suppose we have N distinct observations and we choose to have C distinct colors, the quintile index could be calculated by T = N/C. Each quantile would contain T observations and would be assigned an appropriate color value based on their intensities. The image below shows the idea behind this SOCR Motion Charts improvement allowing input of significantly skewed data (top, A). Instead of using the default uniform color distribution over the support of the data distribution (middle, B), the new approach will employ a quantile-based color indexing to assign colors according to the true data density (bottom, C).
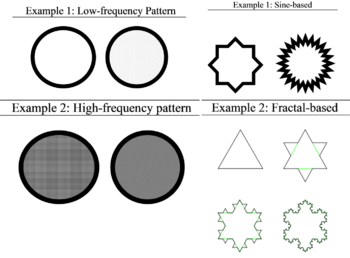
- The second proposed extension involves supporting a greater number of dimensions. Currently, the x-coordinate, y-coordinates, size, and color of the blob are the supported dimensions (excluding the temporal/indexed component). The proposed extension involves including the eccentricity, fill pattern, and stroke shape as extra dimensions. The eccentricity of the blob would indicate the directionality of the data and would be specified by a 2x2 variance-covariance matrix. The fill pattern of the blob could indicate data frequency—the higher the frequency of the data, the higher the frequency of the fill pattern. Finally, the stroke shape of the blob refers to the oscillatory complexity of the blob boundary. This dimension could be mapped to any ordered value. The higher the value in relation to other values in the column, the greater the boundary complexity would be, see Figure 8B. The boundary complexities could be determined through sine-wave based methods or fractal based methods. The figure below shows the SOCR Motion Charts improvement providing blob-appearance cues. For example, the blob fill pattern may indicate data frequency (left, A), and the shape of the blob boundary may represent another variable (right, B).
- Smooth Motion Animation: Provide a preference-based mechanism for controlling the smoothness of the motion-chart animation with time. See the options of PowerPoint's animation interface (e.g., delays, smooth starting and ending points, etc.)
Exemplary tools that can be employed
- JSXGraph HTML5/JS Mathematical Functions Charts and graphs
- D3
- See the JavaScript InfoVis Toolkit
- Manual Graphics Paint canvas in HTML5
- RGraph HTML5 Charts and Graphs
- Rendera: Interactive HTML5/CSS3/JS web-page Editor
Social networking/sharing
The HTML5 MotionChart should allow users that have online data to share their entire web-app state (in playable format) with any other user using unique URL's. For example:
This unique URL motion-chart play format uses the following components:
- Main Applet URL: http://SOCR.ucla.edu/htmls/HTML5/MotionChart/
- PHP script that harvests the tabular data from URL: File:Jnlp writer php.zip
- Reference to an online Dataset (tabular format required): ?http://wiki.stat.ucla.edu/socr/index.php/SOCR_Data_Dinov_010309_HousingPriceIndex
- Variable Mapping Syntax: &key=year&x=HPI&y=UR&size=pop&color=region&category=State
- Load-only or Play action: &play=true
See this example using similar invocation protocol for the Pipeline environment (http://ucla.in/xIL1E8).
See also
- SOCR MotionCharts Wiki Page
- SOCR MotionCharts Web-based (Java) Applet
- Google (Flash) MotionCharts
- More About MotionCharts (Wikipedia)
References
- Dinov, ID, Christou, N. (2011) Web-based tools for modelling and analysis of multivariate data: California ozone pollution activity, International Journal of Mathematical Education in Science and Technology (JMEST), 42(6):789-805, DOI: 10.1080/0020739X.2011.562315.
- Al-Aziz, J, Christou, N, Dinov, ID. (2010). SOCR Motion Charts: An Efficient, Open-Source, Interactive and Dynamic Applet for Visualizing Longitudinal Multivariate Data, JSE, 18(3), 1-29.
Translate this page:


