Difference between revisions of "SOCR EduMaterials AnalysisActivities OneT"
(→One Sample T-Test Example) |
|||
| (16 intermediate revisions by 2 users not shown) | |||
| Line 1: | Line 1: | ||
| + | == [[SOCR_EduMaterials_AnalysesActivities | SOCR Analysis]] - SOCR Analyses Example on One Sample T-Test == | ||
| − | + | This SOCR Activity demonstrates the utilization of the SOCR Analyses package for statistical Computing. In particular, it shows how to use One Sample T-Test with SOCR. | |
| − | |||
| − | |||
==One Sample T-Test Background== | ==One Sample T-Test Background== | ||
| Line 8: | Line 7: | ||
==One Sample T-Test Example== | ==One Sample T-Test Example== | ||
| − | We will demonstrate One Sample T-Test with some SOCR built-in examples. This example is based on the data taken from the statistical program "R." For more information of the R program, please see [http://cran.r-project.org/ CRAN Home Page]. The dataset used here is "shoes" under R's "MASS" library. In the dataset, ten boys are given to the wear of shoes of materials A and B for one foot. The worn level is recorded and difference is obtained. We'd like to find if one material is better than the other. The difference is | + | Go to the [http://www.socr.ucla.edu/htmls/ana/OneSampleTTest_Analysis.html SOCR One-Sample T-Test Applet]. We will demonstrate One Sample T-Test with some SOCR built-in examples. This example is based on the data taken from the statistical program "R." For more information of the R program, please see [http://cran.r-project.org/ CRAN Home Page]. The dataset used here is "shoes" under R's "MASS" library. In the dataset, ten boys are given to the wear of shoes of materials A and B for one foot. The worn level is recorded and difference is obtained. We'd like to find if one material is better than the other. The difference is calculated by B - A. (Note: this example is also used in another three SOCR demonstration: [http://wiki.stat.ucla.edu/socr/index.php/SOCR_EduMaterials_AnalysisActivities_TwoPairedT Two Paired Sample T-Test], [http://wiki.stat.ucla.edu/socr/index.php/SOCR_EduMaterials_AnalysisActivities_TwoPairedSign Two Paired Sample Sign Test], and [http://wiki.stat.ucla.edu/socr/index.php/SOCR_EduMaterials_AnalysisActivities_TwoPairedRank Two Paired Sample Signed Rank Test]. If you'd like to see the data of each material, go to the page of these activities or directly look for them in the SOCR Applet. |
Here's the steps of the activity: | Here's the steps of the activity: | ||
'''1.''' Click on '''One Sample T-Test''' at the left panel's combo box. | '''1.''' Click on '''One Sample T-Test''' at the left panel's combo box. | ||
| − | <center>[[Image: | + | <center>[[Image:SOCR_AnalysisActivities_OneT_Rev1_Fig1.png|500px]]</center> |
| − | <center>[[Image: | + | <center>[[Image:SOCR_AnalysisActivities_OneT_Rev1_Fig2.png|450px]]</center> |
| − | + | On the right panel, first click on '''EXAMPLE 1''' and next click on "Data" to retrieve the demonstrated example. Note that for the [[AP_Statistics_Curriculum_2007_Infer_2Means_Dep#Test_Statistics|1-sample T-test, you need to specify null-value]] for your research hypothesis (typically zero). | |
| − | <center>[[Image: | + | <center>[[Image:SOCR_AnalysisActivities_OneT_Rev1_Fig3.png|500px]]</center> |
| − | '''2.''' Click on the "'''Mapping'''" button to get to the "'''Mapping'''" panel. Click on '''" | + | '''2.''' Click on the "'''Mapping'''" button to get to the "'''Mapping'''" panel. Click on '''"ADD"''' under '''VARIABLE''' to add the variable for One Sample T-Test. Here, the Column X = contains the single sample (which could represent the difference X = A-B, for paired samples). Don't worry about the other columns (C2, C3, etc.) |
| − | <center>[[Image: | + | <center>[[Image:SOCR_AnalysisActivities_OneT_Rev1_Fig4.png|500px]]</center> |
'''3.''' Click on "'''Calculate'''" then "'''Result'''" to see the results. | '''3.''' Click on "'''Calculate'''" then "'''Result'''" to see the results. | ||
| + | |||
| + | Click '''Calculate''' and select the null-value (typically zero, but could be any real number). | ||
| + | <center>[[Image:SOCR_AnalysisActivities_OneT_Rev1_Fig5.png|500px]]</center> | ||
| + | |||
| + | In the '''Results''' tab you will see the output of the analysis (using the default low-precision calculations). | ||
| + | |||
| + | <center>[[Image:SOCR_AnalysisActivities_OneT_Rev1_Fig6.png|500px]]</center> | ||
| + | |||
| + | Note that if you play with the accuracy parameter (in the left panel) the results would appear slightly differently. | ||
| + | |||
| + | <center>[[Image:SOCR_AnalysisActivities_OneT_Rev1_Fig7.png|500px]]</center> | ||
| + | |||
| + | '''Questions for students:''' Use some of the other example datasets, other [[SOCR_Data|SOCR Data]] or copy-paste your own-data. Formulate appropriate research hypotheses about the data, complete the 1-sample t-test and explain your inference. | ||
| + | |||
| + | ==See also== | ||
| + | * [[SOCR_EduMaterials_AnalysisActivities_OneZ| One-Sample Z-Test]] | ||
| + | * [[AP_Statistics_Curriculum_2007_Infer_2Means_Dep#Test_Statistics|EBook chapter on 1-sample T-test (including examples)]] | ||
| − | + | {{translate|pageName=http://wiki.stat.ucla.edu/socr/index.php?title=SOCR_EduMaterials_AnalysisActivities_OneT}} | |
Latest revision as of 22:34, 7 November 2012
Contents
SOCR Analysis - SOCR Analyses Example on One Sample T-Test
This SOCR Activity demonstrates the utilization of the SOCR Analyses package for statistical Computing. In particular, it shows how to use One Sample T-Test with SOCR.
One Sample T-Test Background
The theory used is Student's T-distribution (try opening it in a new window so you can keep this page). A vector of data is to be tested if it's mean is significantly not equal to zero, or less than, or greater than zero.
One Sample T-Test Example
Go to the SOCR One-Sample T-Test Applet. We will demonstrate One Sample T-Test with some SOCR built-in examples. This example is based on the data taken from the statistical program "R." For more information of the R program, please see CRAN Home Page. The dataset used here is "shoes" under R's "MASS" library. In the dataset, ten boys are given to the wear of shoes of materials A and B for one foot. The worn level is recorded and difference is obtained. We'd like to find if one material is better than the other. The difference is calculated by B - A. (Note: this example is also used in another three SOCR demonstration: Two Paired Sample T-Test, Two Paired Sample Sign Test, and Two Paired Sample Signed Rank Test. If you'd like to see the data of each material, go to the page of these activities or directly look for them in the SOCR Applet.
Here's the steps of the activity:
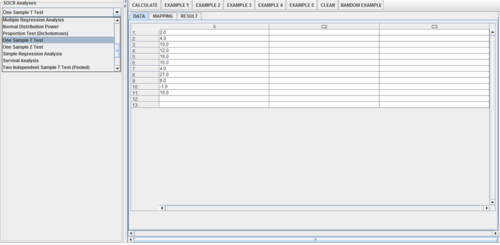
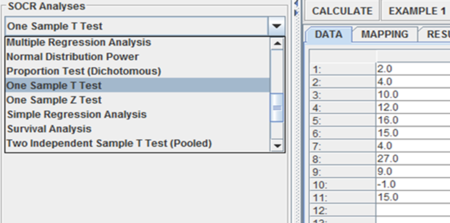
1. Click on One Sample T-Test at the left panel's combo box.


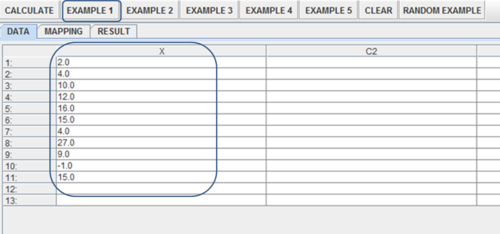
On the right panel, first click on EXAMPLE 1 and next click on "Data" to retrieve the demonstrated example. Note that for the 1-sample T-test, you need to specify null-value for your research hypothesis (typically zero).

2. Click on the "Mapping" button to get to the "Mapping" panel. Click on "ADD" under VARIABLE to add the variable for One Sample T-Test. Here, the Column X = contains the single sample (which could represent the difference X = A-B, for paired samples). Don't worry about the other columns (C2, C3, etc.)

3. Click on "Calculate" then "Result" to see the results.
Click Calculate and select the null-value (typically zero, but could be any real number).

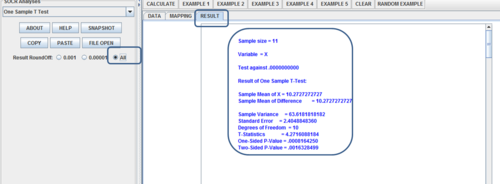
In the Results tab you will see the output of the analysis (using the default low-precision calculations).
Note that if you play with the accuracy parameter (in the left panel) the results would appear slightly differently.

Questions for students: Use some of the other example datasets, other SOCR Data or copy-paste your own-data. Formulate appropriate research hypotheses about the data, complete the 1-sample t-test and explain your inference.
See also
Translate this page: