Difference between revisions of "SMHS BigDataBigSci CrossVal"
(→Overview) |
(→Overfitting) |
||
| Line 31: | Line 31: | ||
[[Image:SMHS BigDataBigSci_CrossVal2.png|400px]] | [[Image:SMHS BigDataBigSci_CrossVal2.png|400px]] | ||
| + | |||
| + | '''Example (Google Flu Trends):''' A March 14, 2014 article in Science (''DOI: 10.1126/science.1248506''), identified problems in Google Flu Trends (http://www.google.org/flutrends/about/#US), DOI 10.1371/journal.pone.0023610, which may be attributed in part to overfitting. In February 2013, Nature reported that GFT was predicting more than double the proportion of doctor visits for influenza-like illness (ILI) than the Centers for Disease Control and Prevention (CDC), despite the fact that GFT was built to predict CDC reports. | ||
==See also== | ==See also== | ||
Revision as of 09:23, 10 May 2016
Contents
Big Data Science - Internal) Statistical Cross-Validaiton
Questions
• What does it mean to validate a result, a method, approach, protocol, or data?
• Can we do “pretend” validations that closely mimic reality?
Validation is the scientific process of determining the degree of accuracy of a mathematical, analytic or computational model as a representation of the real world based on the intended model use. There are various challenges with using observed experimental data for model validation:
1. Incomplete details of the experimental conditions may be subject to boundary and initial conditions, sample or material properties, geometry or topology of the system/process.
2. Limited information about measurement errors due to lack of experimental uncertainty estimates.
Empirically observed data may be used to evaluate models with conventional statistical tests applied subsequently to test null hypotheses (e.g., that the model output is correct). In this process, the discrepancy between some model-predicted values and their corresponding/observed counterparts are compared. For example, a regression model predicted values may be compared to empirical observations. Under parametric assumptions of normal residuals and linearity, we could test null hypotheses like slope = 1 or intercept = 0. When comparing the model obtained on one training dataset to an independent dataset, the slope may be different from 1 and/or the intercept may be different from 0. The purpose of the regression comparison is a formal test of the hypothesis (e.g., slope = 1, mean observed =meanpredicted, then the distributional properties of the adjusted estimates are critical in making an accurate inference. The logistic regression test is another example for comparing predicted and observed values. Measurement errors may creep in, due to sampling or analytical biases, instrument reading or recording errors, temporal or spatial sampling sample collection discrepancies, etc.
Overview
Cross-validation
Cross-validation is a method for validating of models by assessing the reliability and stability of the results of a statistical analysis (e.g., model predictions) based on independent datasets. For prediction of trend, association, clustering, etc., a model is usually trained on one dataset (training data) and tested on new unknown data (testing dataset). The cross-validation method defines a test dataset to evaluate the model avoiding overfitting (the process when a computational model describes random error, or noise, instead of underlying relationships in the data).
Overfitting
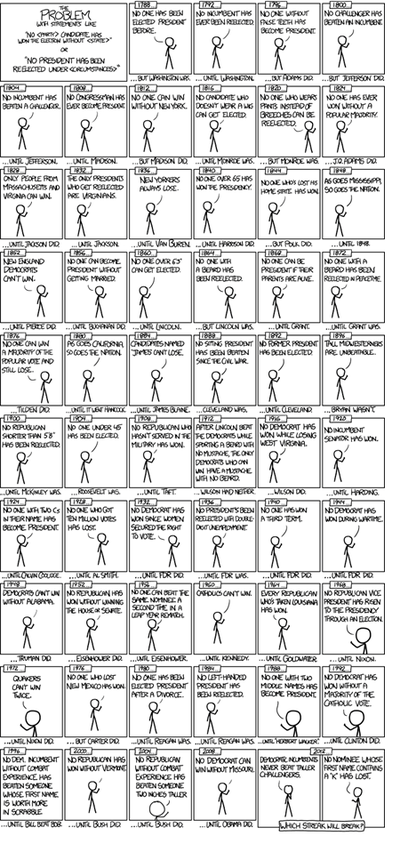
Example (US Presidential Elections): By 2014, there have been only 56 presidential elections and 43 presidents. That is a small dataset, and learning from it may be challenging. If the predictor space expands to include things like having false teeth, it's pretty easy for the model to go from fitting the generalizable features of the data (the signal) and to start matching the noise. When this happens, the quality of the fit on the historical data may improve (e.g., better R2), but the model may fail miserably when used to make inferences about future presidential elections.
(Figure from http://xkcd.com/1122/)
Example (Google Flu Trends): A March 14, 2014 article in Science (DOI: 10.1126/science.1248506), identified problems in Google Flu Trends (http://www.google.org/flutrends/about/#US), DOI 10.1371/journal.pone.0023610, which may be attributed in part to overfitting. In February 2013, Nature reported that GFT was predicting more than double the proportion of doctor visits for influenza-like illness (ILI) than the Centers for Disease Control and Prevention (CDC), despite the fact that GFT was built to predict CDC reports.
See also
- Structural Equation Modeling (SEM)
- Growth Curve Modeling (GCM)
- Generalized Estimating Equation (GEE) Modeling
- Back to Big Data Science
- SOCR Home page: http://www.socr.umich.edu
Translate this page:

