Difference between revisions of "SOCR EduMaterials Activities CompassPlot"
(→Background) |
(→Description) |
||
| (One intermediate revision by the same user not shown) | |||
| Line 9: | Line 9: | ||
== Summary== | == Summary== | ||
This activity describes the construction of the compass plot in SOCR. The applets can be accessed at [http://www.socr.ucla.edu/htmls/SOCR_Charts.html SOCR Charts] under the Miscellaneous folder. | This activity describes the construction of the compass plot in SOCR. The applets can be accessed at [http://www.socr.ucla.edu/htmls/SOCR_Charts.html SOCR Charts] under the Miscellaneous folder. | ||
| + | |||
| + | == Goals== | ||
| + | The aims of this activity is to: | ||
| + | * show how to implement the compass plot in specified projects or areas of research | ||
| + | * display how to use the compass plot in SOCR Charts | ||
== Description == | == Description == | ||
| Line 17: | Line 22: | ||
The image above is simple illustration of a Compass Plot. Notice that the compass is labeled with direction and the vectors are pointing in a specific direction. | The image above is simple illustration of a Compass Plot. Notice that the compass is labeled with direction and the vectors are pointing in a specific direction. | ||
| + | |||
| + | * '''Exercise 1:''' Illustrating the image of the compass plot, what kind of variables may be used in this type of chart? What does the illustration mean? Can any conclusions be drawn? | ||
| + | * '''Exercise 2:''' Suppose you are given the fault line of five different types of earth quakes. Using this information, create a compass plot based on the direction and angle of earth quakes. | ||
== Data Type and Format == | == Data Type and Format == | ||
Latest revision as of 13:47, 4 May 2008
Contents
[hide]COMPASS PLOT
Background
For two-dimensions, a compass plot is a group of positioned vectors from the origin. While the compass obtains vectors of XY-values, it is often useful for polar trajectories and particle motion. By conversion, the corresponding values may be changed into Cartesian coordinates.
For references, visit MATLAB Compass Plot and Compass Plots.
Summary
This activity describes the construction of the compass plot in SOCR. The applets can be accessed at SOCR Charts under the Miscellaneous folder.
Goals
The aims of this activity is to:
- show how to implement the compass plot in specified projects or areas of research
- display how to use the compass plot in SOCR Charts
Description
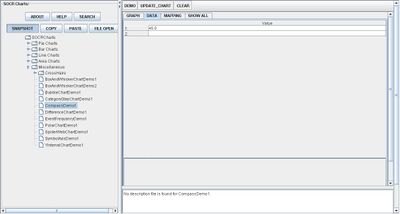
Go to the SOCR Charts and select Miscellaneous from the items located on the left, then select Compass Demo:

The image above is simple illustration of a Compass Plot. Notice that the compass is labeled with direction and the vectors are pointing in a specific direction.
- Exercise 1: Illustrating the image of the compass plot, what kind of variables may be used in this type of chart? What does the illustration mean? Can any conclusions be drawn?
- Exercise 2: Suppose you are given the fault line of five different types of earth quakes. Using this information, create a compass plot based on the direction and angle of earth quakes.
Data Type and Format
By clicking Data between the Graph and Mapping button, it allows users to input or vary the values of the data set. The angle of the data set is only needed to create a Compass Chart as the image below demonstrates this:

Applications
One of the most persuasive elements when proposing data and literature to others is a well-designed chart presentation.
Compass Plots are useful when data takes form of Cartesian and Polar coordinates. In these cases, mathematicians often deal with converting from different coordinate systems to display research outcomes, thus, this application may be able to present their findings in a simple way.
Translate this page: