Difference between revisions of "SOCR EduMaterials Activities CoinDieExperiment"
(→This an activity to explore the distribution of the die score (<math> Y </math>) when first a coin is tossed.) |
(→Applications - Conditional Probability) |
||
| (8 intermediate revisions by 2 users not shown) | |||
| Line 1: | Line 1: | ||
| − | == This an activity to explore the distribution of the die score (<math> Y </math>) when | + | == This is an activity to explore the distribution of the die score (<math> Y </math>) when a coin is tossed first. == |
| − | + | ==Description== | |
| + | The [http://socr.ucla.edu/htmls/exp/Coin_Die_Experiment.html coin die experiment] consists of first tossing a coin, and then rolling a red die if the coin lands head or a green die if the coin lands tails. The value of the coin (1 for heads and 0 for tails) and the score on the die that is rolled are recorded on each update. You can specify the die distribution of the dice by clicking on the die probability buttons; these buttons bring up the die probability dialog box. You can define your own distribution by typing probabilities into the text fields of the dialog box, or you can click on one of the buttons in the dialog box to specify one of the following special distributions: fair, 1-6 flat, 2-5 flat, 3-4 flat, skewed left, or skewed right. he probability of heads p for the coin can be varied with a scroll bar. The density and moments of the die that is rolled are shown in the distribution graph and distribution table | ||
| + | |||
| + | ==Experiment== | ||
| + | Go to [http://www.socr.ucla.edu/htmls/SOCR_Experiments.html SOCR Experiments] and use the scroll bar to find the '''Coin Die Experiment'''. Once you find it, click on the About button and read about the experiment. Below you can see the outcome of 10 runs of the experiment. | ||
<center>[[Image: SOCR_Activities_CoinDie_Christou_coindie.jpg|600px]]</center> | <center>[[Image: SOCR_Activities_CoinDie_Christou_coindie.jpg|600px]]</center> | ||
| + | ==Activities== | ||
Answer the following questions: | Answer the following questions: | ||
| − | + | * There are two random variables (<math> X, \ Y </math>), one parameter (<math> p </math>) for the coin, and the probability distribution that governs each die (green or red) involved in this experiment. Describe what each one represents. | |
| − | + | * Choose fair coin (<math> p = 0.5 </math>), and fair dice (green and red). Perform 100 runs, take a snapshot and comment. | |
| + | |||
| + | * Reset. Choose <math> p=0.8 </math>, 1-6 flat for the green die, 3-4 flat for the red die. Construct the probability distribution of <math> Y </math>, compute the mean of <math> Y </math>, and the standard deviation of <math> Y </math>. Verify that they agree with the ones in the applet. | ||
| + | |||
| + | * Reset. Choose <math> p=0.2 </math>, green fair die, 2-5 flat for red die, perform 100 runs, take a snapshot and comment. | ||
| + | |||
| + | ==Applications: [[AP_Statistics_Curriculum_2007_Prob_Rules#Conditional_Probability | Conditional Probability]]== | ||
| + | |||
| + | The [http://socr.ucla.edu/htmls/exp/Coin_Die_Experiment.html SOCR Coin-Die Experiment] may be used to demonstrate the notion of [[AP_Statistics_Curriculum_2007_Prob_Rules#Conditional_Probability | conditional probability]]. | ||
| + | |||
| + | Go to the [http://socr.ucla.edu/htmls/exp/Coin_Die_Experiment.html Coin Die Experiment]. Here independence of the ''outcome of the die (event B)'', relative to the ''outcome of the coin (event A)'', is ensured by setting the probabilities of both dice to be identical, see the image below. For example, an experiment of 30 samples provides the following results (note that ''p=0.8''!): | ||
| + | : ''P(A={Coin=H})=23/30'' | ||
| + | : ''P(B={Die-outcome=5})= 3/30 = 1/10'' | ||
| + | : <math>P(A|B) = {P(AB) \over P(B)} = {2/30 \over 3/30} = 20/30 \approx P(A) = 23/30</math>. So, here, independence is controlled by making the two dice have the same probability distributions. Altering the distributions of the 2 dice will introduce a dependence between the events ''A'' and ''B''. Try to validate it by this applet simulation. | ||
| − | + | <center>[[Image: SOCR_Activities_CoinDie_Dinov_091208.png|600px]]</center> | |
| − | + | <hr> | |
| + | * SOCR Home page: http://www.socr.ucla.edu | ||
| + | {{translate|pageName=http://wiki.stat.ucla.edu/socr/index.php?title=SOCR_EduMaterials_Activities_CoinDieExperiment}} | ||
Latest revision as of 18:01, 12 September 2008
Contents
[hide]This is an activity to explore the distribution of the die score (\( Y \)) when a coin is tossed first.
Description
The coin die experiment consists of first tossing a coin, and then rolling a red die if the coin lands head or a green die if the coin lands tails. The value of the coin (1 for heads and 0 for tails) and the score on the die that is rolled are recorded on each update. You can specify the die distribution of the dice by clicking on the die probability buttons; these buttons bring up the die probability dialog box. You can define your own distribution by typing probabilities into the text fields of the dialog box, or you can click on one of the buttons in the dialog box to specify one of the following special distributions: fair, 1-6 flat, 2-5 flat, 3-4 flat, skewed left, or skewed right. he probability of heads p for the coin can be varied with a scroll bar. The density and moments of the die that is rolled are shown in the distribution graph and distribution table
Experiment
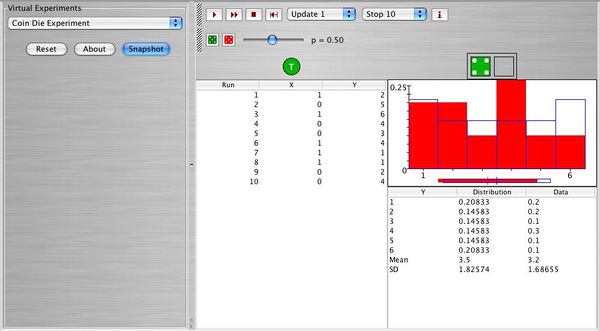
Go to SOCR Experiments and use the scroll bar to find the Coin Die Experiment. Once you find it, click on the About button and read about the experiment. Below you can see the outcome of 10 runs of the experiment.

Activities
Answer the following questions:
- There are two random variables (\( X, \ Y \)), one parameter (\( p \)) for the coin, and the probability distribution that governs each die (green or red) involved in this experiment. Describe what each one represents.
- Choose fair coin (\( p = 0.5 \)), and fair dice (green and red). Perform 100 runs, take a snapshot and comment.
- Reset. Choose \( p=0.8 \), 1-6 flat for the green die, 3-4 flat for the red die. Construct the probability distribution of \( Y \), compute the mean of \( Y \), and the standard deviation of \( Y \). Verify that they agree with the ones in the applet.
- Reset. Choose \( p=0.2 \), green fair die, 2-5 flat for red die, perform 100 runs, take a snapshot and comment.
Applications: Conditional Probability
The SOCR Coin-Die Experiment may be used to demonstrate the notion of conditional probability.
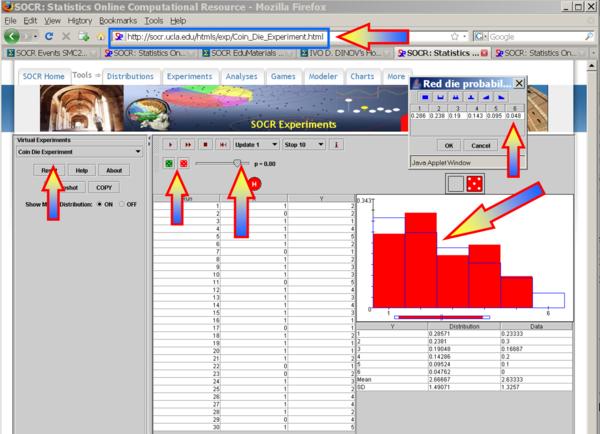
Go to the Coin Die Experiment. Here independence of the outcome of the die (event B), relative to the outcome of the coin (event A), is ensured by setting the probabilities of both dice to be identical, see the image below. For example, an experiment of 30 samples provides the following results (note that p=0.8!):
- P(A={Coin=H})=23/30
- P(B={Die-outcome=5})= 3/30 = 1/10
\[P(A|B) = {P(AB) \over P(B)} = {2/30 \over 3/30} = 20/30 \approx P(A) = 23/30\]. So, here, independence is controlled by making the two dice have the same probability distributions. Altering the distributions of the 2 dice will introduce a dependence between the events A and B. Try to validate it by this applet simulation.

- SOCR Home page: http://www.socr.ucla.edu
Translate this page: