Difference between revisions of "SOCR ResamplingSimulation Activity"
(→Learning Activity) |
|||
| (2 intermediate revisions by the same user not shown) | |||
| Line 2: | Line 2: | ||
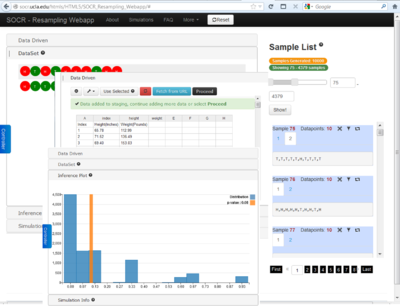
This activity illustrates the processes of sampling, resampling, similation and randomization using the SOCR [http://socr.ucla.edu/htmls/HTML5/SOCR_Resampling_Webapp/ Resampling, Randomization and Simulation Webapp]. It is implemented in HTML5/JavaScript and should be portable on any computer, operating system and web-browser. | This activity illustrates the processes of sampling, resampling, similation and randomization using the SOCR [http://socr.ucla.edu/htmls/HTML5/SOCR_Resampling_Webapp/ Resampling, Randomization and Simulation Webapp]. It is implemented in HTML5/JavaScript and should be portable on any computer, operating system and web-browser. | ||
| + | [[Image:SOCR_ResamplingSimulation_Activity_Fig1.png|150px|thumbnail|right| [http://socr.ucla.edu/htmls/HTML5/SOCR_Resampling_Webapp/ SOCR Resampling Webapp] ]] | ||
==Goals== | ==Goals== | ||
| Line 18: | Line 19: | ||
# Test the webapp | # Test the webapp | ||
# [https://github.com/SOCRedu/Resampling-Randomization-WebApp Report any constructive and critical feedback] | # [https://github.com/SOCRedu/Resampling-Randomization-WebApp Report any constructive and critical feedback] | ||
| + | |||
| + | <center>[[Image:SOCR_ResamplingSimulation_Activity_Fig2.png|400px]] | ||
| + | </center> | ||
==Learning Activity== | ==Learning Activity== | ||
| Line 26: | Line 30: | ||
* You can either generate random data or copy-paste in your own data. For instance you can generate data using coins/cards, etc., or use one of the [[SOCR_Data|SOCR datasets]] (e.g., [[SOCR_Data_Dinov_020108_HeightsWeights| Human Heights/Weights]]) | * You can either generate random data or copy-paste in your own data. For instance you can generate data using coins/cards, etc., or use one of the [[SOCR_Data|SOCR datasets]] (e.g., [[SOCR_Data_Dinov_020108_HeightsWeights| Human Heights/Weights]]) | ||
* Simulation-Driven Randomization Inference: | * Simulation-Driven Randomization Inference: | ||
| − | + | # To use the Coin-Toss experiment to generate data, click “''Binomial Coin Toss''” | |
| − | + | # Choose the parameters -- number of coins, probability of Heads, and number of samples (e.g., k=2) | |
| − | + | # Click “''Generate Dataset''“ (you can click this button multiple times, notice how the data samples change) | |
| − | + | # Click “''Generate Ransom Samples''” | |
| − | + | # Select sample sizes (e.g., 10) and number of repeated samples (e.g., 10,000) | |
| − | + | # Click the “RUN” button | |
| − | + | # You can inspect all samples (for the k=2 groups) in the right panel of the webapp (use “Show” button and inspect all the glyphs on the top) | |
| − | + | # Then select “Test Statistics”, e.g., p-value, and Click “Infer” button | |
| − | + | # This will automatically open you the “Inference Plot” tab where the randomization distribution (of p-values) is shown and the initial p_o value is drawn on top to show the relation to the resampling-based distribution. | |
| − | + | # You can always make modifications of your prior choices in the “Control” tab. | |
* Data-Driven Randomization Inference: | * Data-Driven Randomization Inference: | ||
| − | + | # Back at the Webapp startup screen select the “Use Excel Datasheet” Option | |
| − | + | # Click the “Reset” button to remove any previous data from the webapp buffer. | |
| − | + | # Copy-paste data from any data-table, For instance from this [[SOCR_Data_Dinov_020108_HeightsWeights|Heights/Weights dataset]]. | |
| − | + | # Let’s select a set of say 20 Weights and click “Use Selected” (this would represent sample 1). Repeat this selection with another set of 20 Weights. | |
| − | + | # Click “Proceed”. You should see a summary indicating the sample-sizes of the 2 groups of data you selected | |
| − | + | # Click “Done” – this will open the “Control” panel | |
| − | + | # Select sample sizes (e.g., 10) and number of repeated samples (e.g., 10,000) | |
| − | + | # Click the “RUN” button | |
| − | + | # You can inspect all samples (for the k=2 groups) in the right panel of the webapp (use “Show” button and inspect all the glyphs on the top) | |
| − | + | # Then select “Test Statistics”, e.g., p-value, and Click “Infer” button | |
| − | + | # This will automatically open you the “Inference Plot” tab where the randomization distribution (of p-values) is shown and the initial p_o value is drawn on top to show the relation to the resampling-based distribution. | |
| − | + | # You can always make modifications of your prior choices in the “Control” tab. | |
* Some new features (e.g., data import from WorldBank and other URLs) will be added it the next 2 weeks | * Some new features (e.g., data import from WorldBank and other URLs) will be added it the next 2 weeks | ||
Latest revision as of 18:17, 10 April 2013
Contents
SOCR Educational Materials - Activities - SOCR Resampling, Randomization and Simulation Activity
This activity illustrates the processes of sampling, resampling, similation and randomization using the SOCR Resampling, Randomization and Simulation Webapp. It is implemented in HTML5/JavaScript and should be portable on any computer, operating system and web-browser.
Goals
The aims of this activity are to:
- Demonstrate the concepts of simulation and data generation
- Illustrate data resampling on a massive scale
- Reinforce the concept of resampling and randomization based statistical inference
- Demonstrate the similarities and differences between parametric-based and resampling-based statistical inference
Background
Random (re)sampling applies stochasticity or randomness in the sampling scheme and reflects what is sampled and what the distribution we sample from is. In parametric-based statistical inference, the random sampling reflects the stochastic nature of selecting observations from the sample space. In contrast, in randomization-based inference (e.g., bootstrapping), the random sampling reflects the resampling and stochastic assignment of units to treatments or groups.
Requirements & usability
A modern web-browser with enabled HTML and JavaScript support is required (mobile devices, tablets and phones should work fine).
- Go to the SOCR Resampling/Simulation Webapp.
- Test the webapp
- Report any constructive and critical feedback

Learning Activity
Load the SOCR resampling and randomization webapp in your browser.
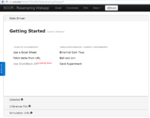
You can perform single sample or multiple sample based statistical inference using this resource. Let's take a 2-sample case as a specific example where we are looking for group differences. Follow this protocol to get some simulations/results (both for teaching/learning randomization-based inference, or do do real data analysis):
- You can either generate random data or copy-paste in your own data. For instance you can generate data using coins/cards, etc., or use one of the SOCR datasets (e.g., Human Heights/Weights)
- Simulation-Driven Randomization Inference:
- To use the Coin-Toss experiment to generate data, click “Binomial Coin Toss”
- Choose the parameters -- number of coins, probability of Heads, and number of samples (e.g., k=2)
- Click “Generate Dataset“ (you can click this button multiple times, notice how the data samples change)
- Click “Generate Ransom Samples”
- Select sample sizes (e.g., 10) and number of repeated samples (e.g., 10,000)
- Click the “RUN” button
- You can inspect all samples (for the k=2 groups) in the right panel of the webapp (use “Show” button and inspect all the glyphs on the top)
- Then select “Test Statistics”, e.g., p-value, and Click “Infer” button
- This will automatically open you the “Inference Plot” tab where the randomization distribution (of p-values) is shown and the initial p_o value is drawn on top to show the relation to the resampling-based distribution.
- You can always make modifications of your prior choices in the “Control” tab.
- Data-Driven Randomization Inference:
- Back at the Webapp startup screen select the “Use Excel Datasheet” Option
- Click the “Reset” button to remove any previous data from the webapp buffer.
- Copy-paste data from any data-table, For instance from this Heights/Weights dataset.
- Let’s select a set of say 20 Weights and click “Use Selected” (this would represent sample 1). Repeat this selection with another set of 20 Weights.
- Click “Proceed”. You should see a summary indicating the sample-sizes of the 2 groups of data you selected
- Click “Done” – this will open the “Control” panel
- Select sample sizes (e.g., 10) and number of repeated samples (e.g., 10,000)
- Click the “RUN” button
- You can inspect all samples (for the k=2 groups) in the right panel of the webapp (use “Show” button and inspect all the glyphs on the top)
- Then select “Test Statistics”, e.g., p-value, and Click “Infer” button
- This will automatically open you the “Inference Plot” tab where the randomization distribution (of p-values) is shown and the initial p_o value is drawn on top to show the relation to the resampling-based distribution.
- You can always make modifications of your prior choices in the “Control” tab.
- Some new features (e.g., data import from WorldBank and other URLs) will be added it the next 2 weeks
Practice experiments
Repeat the protocol above with different (observed or simulated) data, different study designs (e.g., single sample, vs. multiple samples, etc.)
Videos
See also
References
- Dinov, ID, Christou, N and Sanchez, J. (2008) Central Limit Theorem: New SOCR Applet and Demonstration Activity, Journal of Statistics Education, Volume 16, Number 2.
Translate this page:
