Difference between revisions of "SOCR EduMaterials AnalysisActivities Survival"
(→SOCR Analyses Example on Survival Analysis Using the Kaplan-Meyer Method.) |
|||
| (4 intermediate revisions by one other user not shown) | |||
| Line 1: | Line 1: | ||
| − | == SOCR Analyses Example on Survival Analysis Using the Kaplan-Meyer Method. == | + | == [[SOCR_EduMaterials_AnalysesActivities | SOCR Analysis]] - SOCR Analyses Example on Survival Analysis Using the Kaplan-Meyer Method. == |
| − | This example is based on a dataset from "Modern Applied Statistics with S" by Venables and Ripley, Fourth Edition, Springer, 2002. (Page 357) Note that the data is also available in the | + | Go to the [http://www.socr.ucla.edu/htmls/ana/Survival_Analysis.html SOCR Kaplan-Meyer Applet]. This example is based on a dataset from "Modern Applied Statistics with S" by Venables and Ripley, Fourth Edition, Springer, 2002. (Page 357) Note that the data is also available in the free statistical analysis tool R, the dataset '''gehan''' under the library '''MASS'''. |
| − | free statistical analysis tool R, the dataset '''gehan''' under the library '''MASS'''. | ||
In this survival dataset, there are two types of treatment groups, denoted by '''6-MP''' and '''control'''. | In this survival dataset, there are two types of treatment groups, denoted by '''6-MP''' and '''control'''. | ||
| Line 30: | Line 29: | ||
| − | + | '''4.''' After we do the "Mapping" to assign variables, click on the "'''Calculate'''" button. Now we can let the computer show us the survival analysis results by click on the "'''Result'''" button. | |
| − | [[Image:SOCR_AnalysisActivities_Survival_Chu_061407_Fig3.gif|700px]]</center> | + | <center>[[Image:SOCR_AnalysisActivities_Survival_Chu_061407_Fig3.gif|700px]]</center> |
| − | + | '''5.''' To see the survival curves of the groups, click on the "'''Graph'''" button. The dark red and dark blue lines are the estimated survival curves. The light color ones are for the 95% CI bound. This is also shown in the plot legend. The '''RED''' and '''BLUE''' (dark blue) lines are the estimated survival curves, and the '''PINK''' and '''CYAN''' lines are their 95% CI. | |
| − | [[Image:SOCR_AnalysisActivities_Survival_Chu_061407_Fig4.gif|700px]]</center> | + | <center>[[Image:SOCR_AnalysisActivities_Survival_Chu_061407_Fig4.gif|700px]]</center> |
Latest revision as of 15:10, 23 January 2009
SOCR Analysis - SOCR Analyses Example on Survival Analysis Using the Kaplan-Meyer Method.
Go to the SOCR Kaplan-Meyer Applet. This example is based on a dataset from "Modern Applied Statistics with S" by Venables and Ripley, Fourth Edition, Springer, 2002. (Page 357) Note that the data is also available in the free statistical analysis tool R, the dataset gehan under the library MASS.
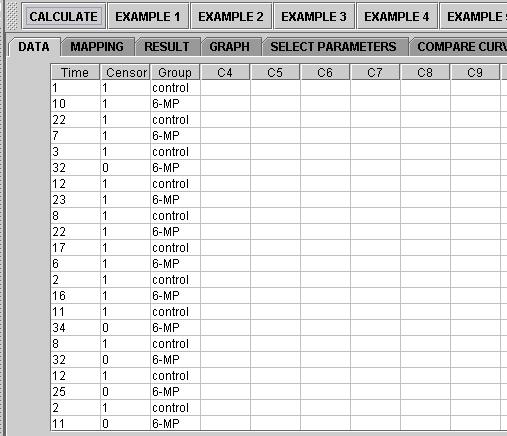
In this survival dataset, there are two types of treatment groups, denoted by 6-MP and control.
The analysis steps:
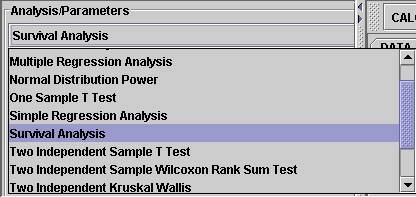
1. As you start the SOCR Analyes Applet, click on "Survival Analysis" from the combo box in the left panel.


2. Then click the button "Example 1" and then "Data", you'll see the data displayed as below. Here, 0 denotes for censored data, and 1 denotes for non-censored data.

3. You'll need to tell the computer which column is the time, treatment group, and censored/non-censored. This is done by "Mapping." Click on the "Mapping" button to assign columns to proper variables.

(Note that, since the columns C4 through C10 do not have data and they are not used, just ignore them.)
4. After we do the "Mapping" to assign variables, click on the "Calculate" button. Now we can let the computer show us the survival analysis results by click on the "Result" button.

5. To see the survival curves of the groups, click on the "Graph" button. The dark red and dark blue lines are the estimated survival curves. The light color ones are for the 95% CI bound. This is also shown in the plot legend. The RED and BLUE (dark blue) lines are the estimated survival curves, and the PINK and CYAN lines are their 95% CI.

Note: if you happen to click on the "Clear" button in the middle of the procedure, all the data will be cleared out. Simply start over from step 1.
Translate this page: