Difference between revisions of "SOCR EduMaterials AnalysisActivities Chi Goodness"
m (→See also) |
|||
| (9 intermediate revisions by 2 users not shown) | |||
| Line 1: | Line 1: | ||
| − | == | + | ==[[SOCR_EduMaterials_AnalysesActivities | SOCR Analysis]] - SOCR Analyses Example on the Chi-Square Goodness of Fit == |
| − | + | Go to the [http://www.socr.ucla.edu/htmls/ana/ChiSquareGF_Analysis.html SOCR Chi-Square Goodness of Fit Applet]. This example is based on the data taken from "Mathematical Statistics and Data Analysis" by John A. Rice, Second Edition, Ducbury Press, 1995, Page 239 - 241. | |
| − | This example is based on the data taken from "Mathematical Statistics and Data Analysis" by John A. Rice, Second Edition, Ducbury Press, 1995 | ||
| − | + | ===Steps=== | |
| − | '''1.''' Click on "'''Chi-Square Model Goodness-of-Fit Test'''" from the | + | '''1.''' Click on "'''Chi-Square Model Goodness-of-Fit Test'''" from the combo box in the left panel. |
| Line 12: | Line 11: | ||
| − | '''2.''' Click on "'''Example | + | '''2.''' Click on "'''Example 1'''" button. than the "Data" button to see the data. |
| − | <center>[[Image:SOCR_AnalysisActivities_ChiGoodness_Chu_061407_Fig2.gif| | + | <center>[[Image:SOCR_AnalysisActivities_ChiGoodness_Chu_061407_Fig2.gif|700px]]</center> |
'''3.''' The data need to be send to the computer for analysis. Click on the "Mapping" button to include the groups you want. | '''3.''' The data need to be send to the computer for analysis. Click on the "Mapping" button to include the groups you want. | ||
| Line 19: | Line 18: | ||
<center>[[Image:SOCR_AnalysisActivities_ChiGoodness_Chu_061407_Fig2A.gif|700px]]</center> | <center>[[Image:SOCR_AnalysisActivities_ChiGoodness_Chu_061407_Fig2A.gif|700px]]</center> | ||
| − | '''4.''' Click on the "''' | + | '''4.''' Click on the "'''Calculate'''" button to enter number of parameters. For example, for a Poisson model, you should enter '1' for that Poisson model has 1 parameter. If you don't enter any number, the default used is 0. |
<center>[[Image:SOCR_AnalysisActivities_ChiGoodness_Chu_061407_Fig2B.gif|700px]]</center> | <center>[[Image:SOCR_AnalysisActivities_ChiGoodness_Chu_061407_Fig2B.gif|700px]]</center> | ||
| + | You'll see a message like below if you don't type in any number. | ||
| + | <center>[[Image:SOCR_AnalysisActivities_ChiGoodness_Chu_061407_Fig2C.gif|700px]]</center> | ||
| − | '''5.''' | + | |
| + | '''5.''' Now you're ready to see the results. Just click on the "Result" button. | ||
<center>[[Image:SOCR_AnalysisActivities_ChiGoodness_Chu_061407_Fig3.gif|700px]]</center> | <center>[[Image:SOCR_AnalysisActivities_ChiGoodness_Chu_061407_Fig3.gif|700px]]</center> | ||
| − | |||
| − | |||
| − | |||
If you'd like to include some other group(s) or remove the current groups and start over, simply go to the '''Mapping''' button and take the groups you want. | If you'd like to include some other group(s) or remove the current groups and start over, simply go to the '''Mapping''' button and take the groups you want. | ||
| + | '''Note''': if you happen to click on the "Clear" button in the middle of the procedure, all the data will be cleared out. Simply start over from step 1 and retrieve the data by click an '''EXAMPLE''' button. | ||
| − | + | ===See also=== | |
| − | + | * [[SOCR_EduMaterials_Activities_BMI_Modeling_Activity|SOCR BMI Modeling Activity]] | |
| − | + | * [[AP_Statistics_Curriculum_2007_Contingency_Fit| SOCR EBook, Chi-Square Modeling]] | |
<hr> | <hr> | ||
| − | {{translate|pageName=http://wiki.stat.ucla.edu/socr/index.php?title= | + | {{translate|pageName=http://wiki.stat.ucla.edu/socr/index.php?title=SOCR_EduMaterials_AnalysisActivities_ChiGoodness}} |
Latest revision as of 18:08, 30 January 2013
SOCR Analysis - SOCR Analyses Example on the Chi-Square Goodness of Fit
Go to the SOCR Chi-Square Goodness of Fit Applet. This example is based on the data taken from "Mathematical Statistics and Data Analysis" by John A. Rice, Second Edition, Ducbury Press, 1995, Page 239 - 241.
Steps
1. Click on "Chi-Square Model Goodness-of-Fit Test" from the combo box in the left panel.

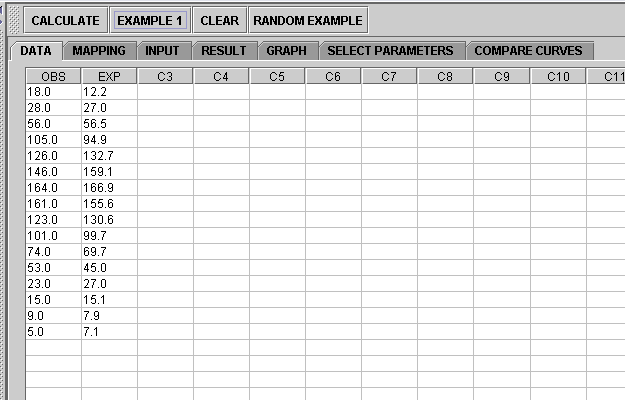
2. Click on "Example 1" button. than the "Data" button to see the data.

3. The data need to be send to the computer for analysis. Click on the "Mapping" button to include the groups you want.

4. Click on the "Calculate" button to enter number of parameters. For example, for a Poisson model, you should enter '1' for that Poisson model has 1 parameter. If you don't enter any number, the default used is 0.

You'll see a message like below if you don't type in any number.

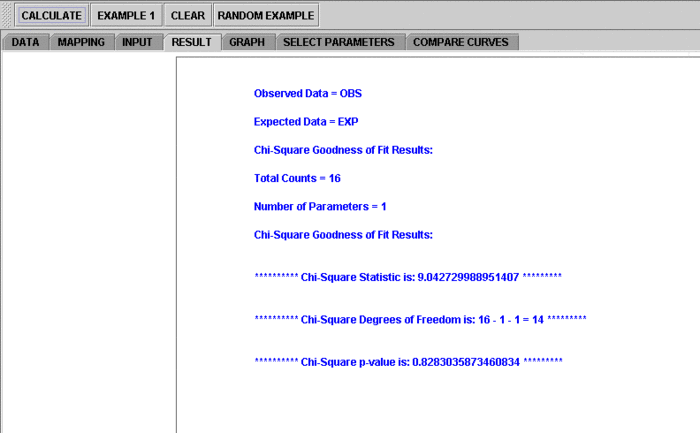
5. Now you're ready to see the results. Just click on the "Result" button.

If you'd like to include some other group(s) or remove the current groups and start over, simply go to the Mapping button and take the groups you want.
Note: if you happen to click on the "Clear" button in the middle of the procedure, all the data will be cleared out. Simply start over from step 1 and retrieve the data by click an EXAMPLE button.
See also
Translate this page: