Difference between revisions of "SMHS BigDataBigSci CrossVal"
(Created page with "== Big Data Science - Internal) Statistical Cross-Validaiton == == Questions == * ==Overview== ==See also== * SMHS_BigDataBigSci_SEM| Structura...") |
(→Questions) |
||
| Line 3: | Line 3: | ||
== Questions == | == Questions == | ||
| − | + | ||
| + | • What does it mean to validate a result, a method, approach, protocol, or data? | ||
| + | |||
| + | • Can we do “pretend” validations that closely mimic reality? | ||
| + | |||
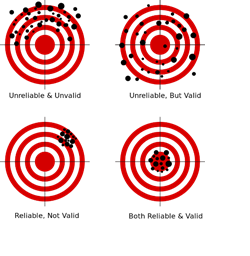
| + | [[Image:SMHS_BigDataBigSci_CrossVal1.png|250px]] | ||
| + | |||
| + | ''Validation'' is the scientific process of determining the degree of accuracy of a mathematical, analytic or computational model as a representation of the real world based on the intended model use. There are various challenges with using observed experimental data for model validation: | ||
| + | |||
| + | 1. Incomplete details of the experimental conditions may be subject to boundary and initial conditions, sample or material properties, geometry or topology of the system/process. | ||
| + | |||
| + | 2. Limited information about measurement errors due to lack of experimental uncertainty estimates. | ||
| + | |||
| + | Empirically observed data may be used to evaluate models with conventional statistical tests applied subsequently to test null hypotheses (e.g., that the model output is correct). In this process, the discrepancy between some model-predicted values and their corresponding/observed counterparts are compared. For example, a regression model predicted values may be compared to empirical observations. Under parametric assumptions of normal residuals and linearity, we could test null hypotheses like ''slope'' = 1 or ''intercept'' = 0. When comparing the model obtained on one training dataset to an independent dataset, the slope may be different from 1 and/or the intercept may be different from 0. The purpose of the regression comparison is a formal test of the hypothesis (e.g., ''slope'' = 1, ''mean'' <sub>''observed''</sub> =''mean<sub>predicted</sub>,'' then the distributional properties of the adjusted estimates are critical in making an accurate inference. The logistic regression test is another example for comparing predicted and observed values. Measurement errors may creep in, due to sampling or analytical biases, instrument reading or recording errors, temporal or spatial sampling sample collection discrepancies, etc. | ||
==Overview== | ==Overview== | ||
Revision as of 09:06, 10 May 2016
Contents
Big Data Science - Internal) Statistical Cross-Validaiton
Questions
• What does it mean to validate a result, a method, approach, protocol, or data?
• Can we do “pretend” validations that closely mimic reality?
Validation is the scientific process of determining the degree of accuracy of a mathematical, analytic or computational model as a representation of the real world based on the intended model use. There are various challenges with using observed experimental data for model validation:
1. Incomplete details of the experimental conditions may be subject to boundary and initial conditions, sample or material properties, geometry or topology of the system/process.
2. Limited information about measurement errors due to lack of experimental uncertainty estimates.
Empirically observed data may be used to evaluate models with conventional statistical tests applied subsequently to test null hypotheses (e.g., that the model output is correct). In this process, the discrepancy between some model-predicted values and their corresponding/observed counterparts are compared. For example, a regression model predicted values may be compared to empirical observations. Under parametric assumptions of normal residuals and linearity, we could test null hypotheses like slope = 1 or intercept = 0. When comparing the model obtained on one training dataset to an independent dataset, the slope may be different from 1 and/or the intercept may be different from 0. The purpose of the regression comparison is a formal test of the hypothesis (e.g., slope = 1, mean observed =meanpredicted, then the distributional properties of the adjusted estimates are critical in making an accurate inference. The logistic regression test is another example for comparing predicted and observed values. Measurement errors may creep in, due to sampling or analytical biases, instrument reading or recording errors, temporal or spatial sampling sample collection discrepancies, etc.
Overview
See also
- Structural Equation Modeling (SEM)
- Growth Curve Modeling (GCM)
- Generalized Estimating Equation (GEE) Modeling
- Back to Big Data Science
- SOCR Home page: http://www.socr.umich.edu
Translate this page:
