Difference between revisions of "SOCR EduMaterials AnalysisActivities Wilcoxon"
(→Two Independent Sample Wilcoxon Test Example) |
(→Two Independent Sample Wilcoxon Test Example) |
||
| Line 1: | Line 1: | ||
| − | ==Two Independent Sample Wilcoxon Test Example== | + | |
| + | ===Two Independent Sample Wilcoxon Test Backgroun=== | ||
| + | Given two groups of data, not necessarily with same sample size, we'd like to test the null hpothesis that the two groups are significantly different, statistically. This is a non-parametric test utilizing ranks of each datum, instead of the it's actual value. | ||
| + | |||
| + | |||
| + | ===Two Independent Sample Wilcoxon Test Example=== | ||
We will demonstrate Two Independent Wilcoxon Test with a SOCR built-in example. | We will demonstrate Two Independent Wilcoxon Test with a SOCR built-in example. | ||
This example is based on the data taken from "Mathematical Statistics and Data Analysis" by John A. Rice, Second Edition, Ducbury Press, 1995. (Page 390) | This example is based on the data taken from "Mathematical Statistics and Data Analysis" by John A. Rice, Second Edition, Ducbury Press, 1995. (Page 390) | ||
| − | Note that this | + | Note that this textbook uses the data for a Two Independent T-Test but we're only taking the data to demonstrate the Wilcoxon Two Independent Sample Rank Test. |
| Line 17: | Line 22: | ||
| − | On the right panel, first click on '''EXAMPLE 1''' and next click on "Data" to retreive the demonstrated example. This is the example we'll be looking at | + | On the right panel, first click on '''EXAMPLE 1''' and next click on "Data" to retreive the demonstrated example. This is the example we'll be looking at. |
<center>[[Image:SOCR_AnalysisActivities_TwoIndepW_Chu_051707_Fig2.gif|700px]]</center> | <center>[[Image:SOCR_AnalysisActivities_TwoIndepW_Chu_051707_Fig2.gif|700px]]</center> | ||
| − | '''2.''' Click on the "'''Mapping'''" button to get to the "'''Mapping'''" panel. Click on '''"ADD"''' under '''VARIABLE 1''' and | + | '''2.''' Click on the "'''Mapping'''" button to get to the "'''Mapping'''" panel. Click on '''"ADD"''' under '''VARIABLE 1''' to add '''A''', and click on '''ADD''' under '''VARIABLE 2''' to add B. We care about the difference, so which on goes to '''VARIABLE 1''' or '''VARIABLE 2''' is arbitrary. Here, the computer will set difference = Variable 2 - Variable 1. If you like the substraction to go the other way around, simple assign '''VARIABLE 1''' and '''VARIABLE 2''' in the opposite way. |
| − | Here, the computer will set difference = Variable 2 - Variable 1. If you like the substraction to go the other way around, simple assign '''VARIABLE 1''' and '''VARIABLE 2''' in | ||
Revision as of 17:07, 6 August 2007
Two Independent Sample Wilcoxon Test Backgroun
Given two groups of data, not necessarily with same sample size, we'd like to test the null hpothesis that the two groups are significantly different, statistically. This is a non-parametric test utilizing ranks of each datum, instead of the it's actual value.
Two Independent Sample Wilcoxon Test Example
We will demonstrate Two Independent Wilcoxon Test with a SOCR built-in example. This example is based on the data taken from "Mathematical Statistics and Data Analysis" by John A. Rice, Second Edition, Ducbury Press, 1995. (Page 390)
Note that this textbook uses the data for a Two Independent T-Test but we're only taking the data to demonstrate the Wilcoxon Two Independent Sample Rank Test.
Here's the steps of the activity:
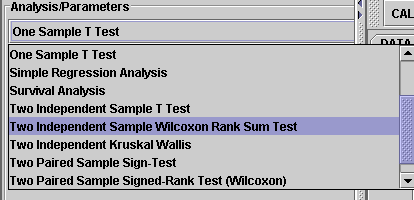
1. Click on Two Independent Sample Wilcoxon Test at the left panel's combo box.


On the right panel, first click on EXAMPLE 1 and next click on "Data" to retreive the demonstrated example. This is the example we'll be looking at.

2. Click on the "Mapping" button to get to the "Mapping" panel. Click on "ADD" under VARIABLE 1 to add A, and click on ADD under VARIABLE 2 to add B. We care about the difference, so which on goes to VARIABLE 1 or VARIABLE 2 is arbitrary. Here, the computer will set difference = Variable 2 - Variable 1. If you like the substraction to go the other way around, simple assign VARIABLE 1 and VARIABLE 2 in the opposite way.

3. Click on "Calculate" then "Result" to see the results.

Questions for students: By looking at the test results, what do you think about the data? What can you say about the two different shoe materials?
Translate this page: