Difference between revisions of "NISER 081107 ID"
| Line 13: | Line 13: | ||
==Motivation/Problem== | ==Motivation/Problem== | ||
[[Image:Largemouth_Bass.jpg|150px|thumbnail|right| [http://en.wikipedia.org/wiki/Largemouth_Bass Largemouth Bass] ]] | [[Image:Largemouth_Bass.jpg|150px|thumbnail|right| [http://en.wikipedia.org/wiki/Largemouth_Bass Largemouth Bass] ]] | ||
| − | |||
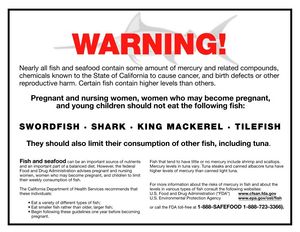
Mercury contamination of edible freshwater fish poses a direct threat to human health. [http://en.wikipedia.org/wiki/Largemouth_Bass Largemouth bass] is a fresh water fish that was studied in 53 different Florida lakes to examine the factors that influence the level of mercury contamination. Water samples were collected from the surface of the middle of each lake in August 1990 and then again in March 1991. The '''pH level''', the '''amount of chlorophyll''', '''calcium''', and '''alkalinity''' were measured in each sample. Also, samples of fish were taken from each lake with sample sizes ranging from 4 to 44 fish. The age of each fish and mercury concentration in the muscle tissue was measured. Since [http://en.wikipedia.org/wiki/Mercury_(element)#Mercury_in_fish fish absorb mercury over time], older fish will tend to have higher concentrations. [http://en.wikipedia.org/wiki/Mercury_(element)#Safety Here is a detailed discussion] of why mercury accumilates in muscle tissues and why is it toxic in larger amounts. | Mercury contamination of edible freshwater fish poses a direct threat to human health. [http://en.wikipedia.org/wiki/Largemouth_Bass Largemouth bass] is a fresh water fish that was studied in 53 different Florida lakes to examine the factors that influence the level of mercury contamination. Water samples were collected from the surface of the middle of each lake in August 1990 and then again in March 1991. The '''pH level''', the '''amount of chlorophyll''', '''calcium''', and '''alkalinity''' were measured in each sample. Also, samples of fish were taken from each lake with sample sizes ranging from 4 to 44 fish. The age of each fish and mercury concentration in the muscle tissue was measured. Since [http://en.wikipedia.org/wiki/Mercury_(element)#Mercury_in_fish fish absorb mercury over time], older fish will tend to have higher concentrations. [http://en.wikipedia.org/wiki/Mercury_(element)#Safety Here is a detailed discussion] of why mercury accumilates in muscle tissues and why is it toxic in larger amounts. | ||
==[[NISER_081107_ID_Data | Data]]== | ==[[NISER_081107_ID_Data | Data]]== | ||
| + | [[Image:NISER_081107_ID_Fig10.png|150px|thumbnail| [[NISER_081107_ID_Data | Data Spreadsheet]] ]] | ||
[[NISER_081107_ID_Data | Largemouth bass were studied in 53 different Florida]] lakes to examine the factors that influence the level of mercury contamination. Water samples were collected from the surface of the middle of each lake in August 1990 and then again in March 1991. The pH level, the amount of chlorophyll, calcium, and alkalinity were measured in each sample. The average of the August and March values were used in the analysis. Next, a sample of fish was taken from each lake with sample sizes ranging from 4 to 44 fish. The age of each fish and mercury concentration in the muscle tissue was measured. | [[NISER_081107_ID_Data | Largemouth bass were studied in 53 different Florida]] lakes to examine the factors that influence the level of mercury contamination. Water samples were collected from the surface of the middle of each lake in August 1990 and then again in March 1991. The pH level, the amount of chlorophyll, calcium, and alkalinity were measured in each sample. The average of the August and March values were used in the analysis. Next, a sample of fish was taken from each lake with sample sizes ranging from 4 to 44 fish. The age of each fish and mercury concentration in the muscle tissue was measured. | ||
| Line 31: | Line 31: | ||
===Physics=== | ===Physics=== | ||
| − | [[Image: | + | [[Image:NISER_081107_ID_Fig11.png|thumb|right| [http://www.falstad.com/qmatom/ Atomic structure].]] |
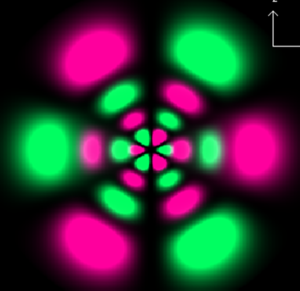
* What is an atom and what is the atomic structure of mercury? | * What is an atom and what is the atomic structure of mercury? | ||
===Biology=== | ===Biology=== | ||
| − | [[Image:NISER_081107_ID_Fig9.png|thumb|right|3D Chlorophyll Structure.]] | + | [[Image:NISER_081107_ID_Fig9.png|thumb|right| [http://www.rcsb.org/pdb/explore.do?structureId=2O01 3D Chlorophyll Structure].]] |
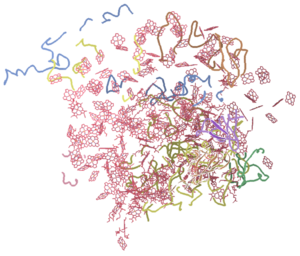
* Why is mercury (and other [http://en.wikipedia.org/wiki/Heavy_metals heavy metals]) accumulating in muscle tissue? | * Why is mercury (and other [http://en.wikipedia.org/wiki/Heavy_metals heavy metals]) accumulating in muscle tissue? | ||
* What causes the toxicity of larger than normal amounts of mercury in the body? | * What causes the toxicity of larger than normal amounts of mercury in the body? | ||
| Line 42: | Line 42: | ||
===Chemistry=== | ===Chemistry=== | ||
| − | [[Image: | + | [[Image:NISER_081107_ID_Fig12.png|thumb|right|Chemistry Thumbnail.]] |
* [http://www.dartmouth.edu/~chemlab/info/resources/p_table/Periodic.html Periodic Table] | * [http://www.dartmouth.edu/~chemlab/info/resources/p_table/Periodic.html Periodic Table] | ||
* [http://en.wikipedia.org/wiki/Alkalinity Alkalinity] | * [http://en.wikipedia.org/wiki/Alkalinity Alkalinity] | ||
Revision as of 16:52, 14 August 2007
Contents
NISER Wiki Resource Prototype - First template for a multi-disciplinary NISER activity
Summary
Visualization, understanding and interpreting real data may be challenging because of noise in the data, data complexity, multiple variables, hidden relations between variables and large variation. This NISER activity demonstrates how to use free Internet-based IT-tools and resources to solve problems that arise in the areas of biological, chemical, medical and social research.
Goals
This NISER activity has the following specific goals:
- to demonstrate the typical research investigation pipeline - from problem formulation, to data collection, visualization, analysis and interpretation;
- to illustrate the variety of portable freely available Internet-based Java tools, computational resources and learning materials for solving practical problems;
- to provide a hands-on example of interdisciplinary training, cross-over of research techniques, data, models and expertise to enhance contemporary science education;
- to promote interactions between different science education areas and stimulate the development of new and synergistic learning materials and course curricula across disciplines.
Motivation/Problem
Mercury contamination of edible freshwater fish poses a direct threat to human health. Largemouth bass is a fresh water fish that was studied in 53 different Florida lakes to examine the factors that influence the level of mercury contamination. Water samples were collected from the surface of the middle of each lake in August 1990 and then again in March 1991. The pH level, the amount of chlorophyll, calcium, and alkalinity were measured in each sample. Also, samples of fish were taken from each lake with sample sizes ranging from 4 to 44 fish. The age of each fish and mercury concentration in the muscle tissue was measured. Since fish absorb mercury over time, older fish will tend to have higher concentrations. Here is a detailed discussion of why mercury accumilates in muscle tissues and why is it toxic in larger amounts.
Data
Largemouth bass were studied in 53 different Florida lakes to examine the factors that influence the level of mercury contamination. Water samples were collected from the surface of the middle of each lake in August 1990 and then again in March 1991. The pH level, the amount of chlorophyll, calcium, and alkalinity were measured in each sample. The average of the August and March values were used in the analysis. Next, a sample of fish was taken from each lake with sample sizes ranging from 4 to 44 fish. The age of each fish and mercury concentration in the muscle tissue was measured.
Challenge
To make a fair comparison of the fish in different lakes using a regression estimate of the expected mercury concentration in a three-year-old fish as the standardized value for each lake. Determine the age of the individual fish in some lakes and correlate this with the average mercury concentration of the sampled fish.
Florida has set a standard of 1/2 part per million as the unsafe level of mercury concentration in edible foods. 45.3% of the lakes exceed this level. The smallest level of mercury concentration that the measuring instrument can detect is 40 parts per billion. Any level below that was set to 40 parts per billion. This, of course, "flattens out" the slope of the relationship at the low end as well as affecting the standardized values. These observations are usually on young fish.
Logarithmic transformations on some of the variables may provide insights into the relationships among the other variables in the study. For instance, alkalinity level may be associated with mercury concentration, and may help account for the higher levels of mercury.
Methods & Approaches
We now discuss varieties of scientific methods, models, tools and strategies for data understanding, inference and solving this problem and discuss checking/affirming underlying assumptions.
Physics
- What is an atom and what is the atomic structure of mercury?
Biology
- Why is mercury (and other heavy metals) accumulating in muscle tissue?
- What causes the toxicity of larger than normal amounts of mercury in the body?
- The Chlorophyll molecule.
- 3D structure of Chlorophyll using PDB/JMol viewer.
Chemistry
- Periodic Table
- Alkalinity
- pH
- See the position of Mercury (Hg) in the interactive Periodic table and discuss its chemical properties.
Engineering
- TBD
Mathematics
- Fit models to some of the variables in this dataset.
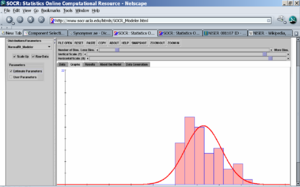
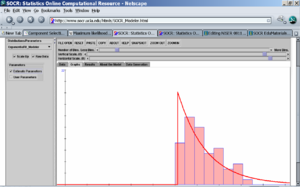
- We can easily compute the histogram of the average (per lake) mercury measurements and fit in Normal, Exponential or other distribution models to the histogram of the average mercury measurement using SOCR Charts and SOCR Modeler (see examples here). The left image below shows the fit of a \(Normal (\mu=10.54, \sigma^2=45.64)\) distribution model and the right image shows the (offset by 0.8) \(Exponential(\lambda = 10.54)\) model fit to the mercury histogram. The parameters in both cases are automatically calculated from the data using maximum likelihood estimation.
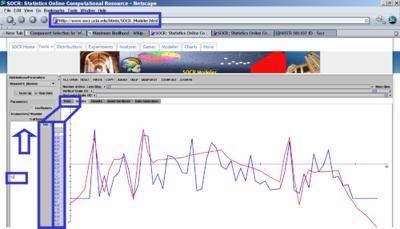
- We can also demonstrate the effect of using a wavelet decomposition of the column data (avg_mercury). The image below demonstrates the wavelet representation of this column vector data using Daubechies' 2 wavelet basis, where only the largest 10% of the wavelet coefficients were used to reconstruct/synthesize the (compressed) wavelet representation of the data. More information about wavelets and wavelets-based activities may be found here. You can use the SOCR Modeler to fit is any of a number of wavelet models to data and observe the effect of wavelet shrinkage on the corresponding wavelet model fit.
- We can easily compute the histogram of the average (per lake) mercury measurements and fit in Normal, Exponential or other distribution models to the histogram of the average mercury measurement using SOCR Charts and SOCR Modeler (see examples here). The left image below shows the fit of a \(Normal (\mu=10.54, \sigma^2=45.64)\) distribution model and the right image shows the (offset by 0.8) \(Exponential(\lambda = 10.54)\) model fit to the mercury histogram. The parameters in both cases are automatically calculated from the data using maximum likelihood estimation.
Statistics
- Are there associations in these data between Alkalinity, pH, Calcium and Chlorophyll? Using SOCR Analyses construct regression plots illustrating the relations between Calcium, Chlorophyll and Avg_Mercury, as shown on the image below.
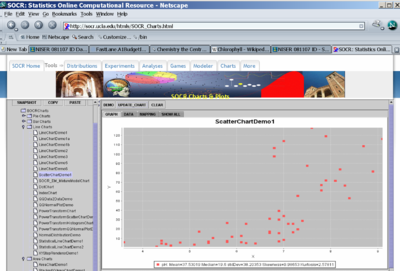
- Generate some exploratory data analyses (EDA plots). For instance, the figure below demonstrates how you can use SOCR Charts to obtain the scatter plot of Alkalinity vs. pH. What are some inferences about the bivariate relations between these variables?
- What is the distribution of the average amount of mercury in the entire sample? We can use SOCR Charts to construct the histogram of the avg_mercury column data. To learn how to use SOCR Charts see these Charts Activities. Notice the effect the bin-size parameter has on the shape of the data histogram (you can smoothly vary this parameter). Although, there are many choices for determining the bin-size parameter, in general, the optimal choice of the histogram bin-size parameter may be determined by \({2\times(IQR)} \over {N^{1\over 3}}\), where the interquartile range \(IQR= Q_3 - Q_1\), and \(Q_3\) and \(Q_1\) are the third and first quartiles for the sample data, respectively.
- Is there evidence of statistical differences between the two groups (according to the age_data variable) in either Alkalinity or pH?
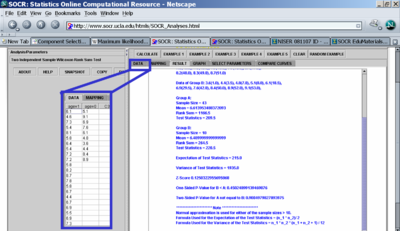
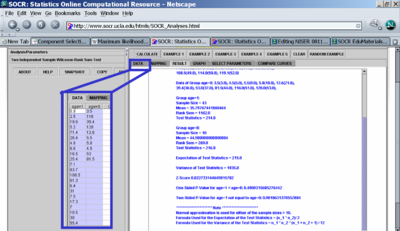
- There does not seem to be a statistically significant difference in the pH levels between the two groups separated by the age_data varaible. A non-parametric Wilcoxon Rank Sum test did not produce significantly small p-value (see the image below showing the result of the calculations using SOCR Analyses.
- Similarly, there does not seem to be a statistically significant difference in the Alkalinity levels between the two groups separated by the age_data variable. The same non-parametric Wilcoxon Rank Sum test did not produce significantly small p-value (see the image below showing the result of the calculations using SOCR Analyses.
- There does not seem to be a statistically significant difference in the pH levels between the two groups separated by the age_data varaible. A non-parametric Wilcoxon Rank Sum test did not produce significantly small p-value (see the image below showing the result of the calculations using SOCR Analyses.
Computational Resources
- Internet-based SOCR Tools (including offline resources, e.g., tables)
Hands-on activities
- TBD (Step-by-step practice problems).
Notes
- Follow the directions in the SOCR Wiki Editing Guide to expand, revise or improve these materials.
Translate this page:


