Difference between revisions of "Help pages for SOCR Distributions"
m (Text replacement - "{{translate|pageName=http://wiki.stat.ucla.edu/socr/" to ""{{translate|pageName=http://wiki.socr.umich.edu/") |
|||
| Line 29: | Line 29: | ||
* To report bugs or make recommendations please visit: http://www.socr.ucla.edu/ | * To report bugs or make recommendations please visit: http://www.socr.ucla.edu/ | ||
| − | {{translate|pageName=http://wiki. | + | "{{translate|pageName=http://wiki.socr.umich.edu/index.php?title=Help_pages_for_SOCR_Distributions}} |
Latest revision as of 12:24, 3 March 2020
This is a general help for the SOCR Distributions included in the list of distributions and some distribution activities.
Contents
Introduction
These interactive distribution applets allow you to:
- Dynamically compute any area under any of the implemented distributions
- Calculate quantiles and percentiles
How to use the Interactive Distribution Applets?
- Select a distribution from the drop-down list in the top-left corner
- Select the parameters of the distribution accordingly (make sure these make sense!)
- Control the left-limit of the area of interest: click the mouse on the graph canvas near the LEFT end of the support of the distribution and drag it to the right. Alternatively, you can use the text areas on the bottom-left to enter the left/right limits numerically
- Control the right-limit of the area of interest: click the mouse near the RIGHT end of the support of the distribution and drag it to the left
- Play with the left and right limits to select the desired area or to find the corresponding tail probabilities.
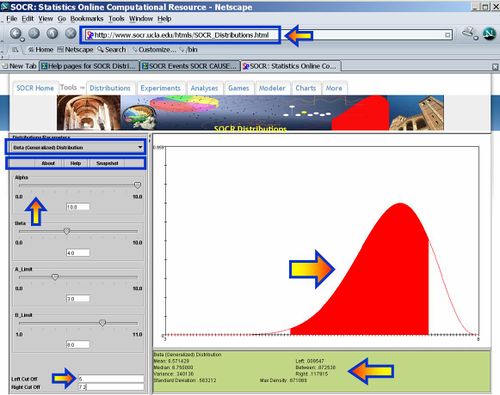
Main Components of SOCR Distribution Applet Interface
- SOCR Distributions URL, in the web browser address bar on the top.
- Left Panel
- Drop-down list of available SOCR Distributions
- Help, About and Snapshot Buttons
- Distribution-specific parameter settings
- Numeric control of left- and right-cut off values
- Right Panel
- Main Interactive Distribution Graphing (top)
- Areas under the density curve on the left, right and between the two cut-off lines (bottom)

Notes
- You can change the parameters of the distribution at any time. We have optimized the applet to show a maximal field-of-view for each distribution for any set of parameters. As a consequence, changing the set of parameters may effect only the scales of the vertical and horizontal axes.
- To report bugs or make recommendations please visit: http://www.socr.ucla.edu/
"-----
Translate this page: