Difference between revisions of "SOCR EduMaterials AnalysisActivities Proportion Test"
(→SOCR Analyses Example on the Proportion Test) |
(→SOCR Analyses Example on the Proportion Test) |
||
| Line 5: | Line 5: | ||
| − | This example is from UCLA STAT 13 "Introduction to Statistical Methods for the Life and Health Sciences" [http://www.stat.ucla.edu/%7Edinov/courses_students.dir/06/Fall/STAT13.1.dir/STAT13_notes.dir lecture06.pdf/Lecture Notes] by Ivo Dinov. (Slide 23) The data are about a studying the effect of aspirin in reducing heart attacks. The data consist of 500 subjects with 17 of them having heart, marked as 1, and the rest marked as 0. | + | This example is from UCLA STAT 13 "Introduction to Statistical Methods for the Life and Health Sciences" [http://www.stat.ucla.edu/%7Edinov/courses_students.dir/06/Fall/STAT13.1.dir/STAT13_notes.dir/lecture06.pdf/Lecture Notes] by Ivo Dinov. (Slide 23) The data are about a studying the effect of aspirin in reducing heart attacks. The data consist of 500 subjects with 17 of them having heart, marked as 1, and the rest marked as 0. |
'''Steps:''' | '''Steps:''' | ||
Revision as of 13:53, 25 August 2007
Proportional Test Background
SOCR Analyses Example on the Proportion Test
This example is from UCLA STAT 13 "Introduction to Statistical Methods for the Life and Health Sciences" Notes by Ivo Dinov. (Slide 23) The data are about a studying the effect of aspirin in reducing heart attacks. The data consist of 500 subjects with 17 of them having heart, marked as 1, and the rest marked as 0.
Steps:
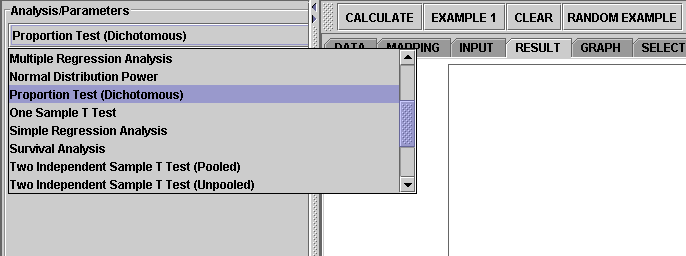
1. Click on "Proportion Test (Dichotomous)" from the conbo box in the left panel.

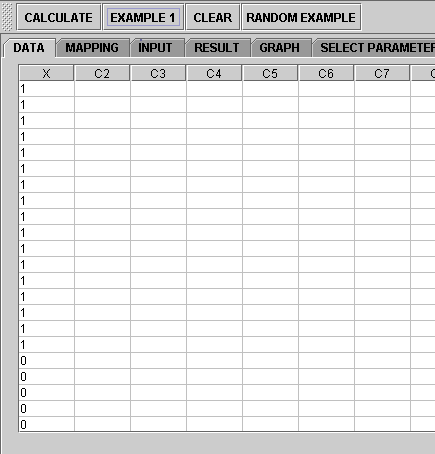
2. Click on "Example 2" button. than the "Data" button to see the data.

3. The data need to be send to the computer for analysis. Click on the "Mapping" button to include the groups you want.

4. Click on the "Input" button to select significance level. Default is 0.05.

5. Next, click on the "Calculate" button. Now you're ready to see the results. Just click on the "Result" button.

Scroll down to see complete results.
If you'd like to include some other group(s) or remove the current groups and start over, simply go to the Mapping button and take the groups you want.
Note: if you happen to click on the "Clear" button in the middle of the procedure, all the data will be cleared out. Simply start over from step 1 and reteive the data by click an EXAMPLE button.
Translate this page: