Difference between revisions of "SOCR EduMaterials AnalysisActivities Chi Contingency"
(→SOCR Analyses Example on the Chi-Square Contingency Table) |
|||
| Line 19: | Line 19: | ||
<center>[[Image:SOCR_AnalysisActivities_ChiTable_Chu_061407_Fig2A.gif|700px]]</center> | <center>[[Image:SOCR_AnalysisActivities_ChiTable_Chu_061407_Fig2A.gif|700px]]</center> | ||
| − | |||
<center>[[Image:SOCR_AnalysisActivities_ChiTable_Chu_061407_Fig2B.gif|700px]]</center> | <center>[[Image:SOCR_AnalysisActivities_ChiTable_Chu_061407_Fig2B.gif|700px]]</center> | ||
| − | |||
<center>[[Image:SOCR_AnalysisActivities_ChiTable_Chu_061407_Fig2C.gif|700px]]</center> | <center>[[Image:SOCR_AnalysisActivities_ChiTable_Chu_061407_Fig2C.gif|700px]]</center> | ||
| + | <center>[[Image:SOCR_AnalysisActivities_ChiTable_Chu_061407_Fig2D.gif|700px]]</center> | ||
'''5.''' Now you're ready to see the results. Just click on the "Result" button. | '''5.''' Now you're ready to see the results. Just click on the "Result" button. | ||
| Line 30: | Line 29: | ||
<center>[[Image:SOCR_AnalysisActivities_ChiTable_Chu_061407_Fig3.gif|700px]]</center> | <center>[[Image:SOCR_AnalysisActivities_ChiTable_Chu_061407_Fig3.gif|700px]]</center> | ||
| − | |||
Revision as of 00:59, 28 August 2007
SOCR Analyses Example on the Chi-Square Contingency Table
This example is based on the data taken from "Mathematical Statistics and Data Analysis" by John A. Rice, Second Edition, Ducbury Press, 1995.
Steps:
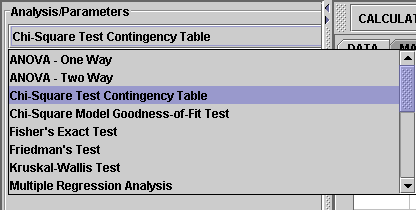
1. Click on "Chi-Square Model Goodness-of-Fit Test" from the conbo box in the left panel.

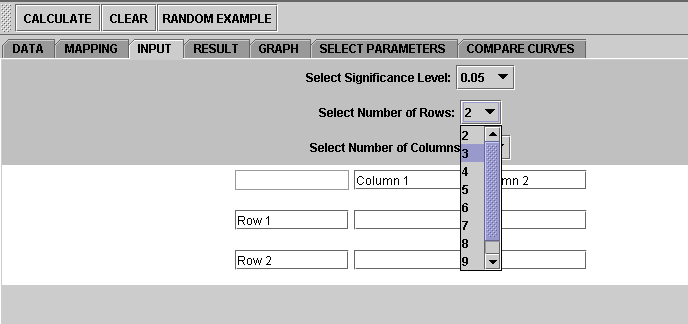
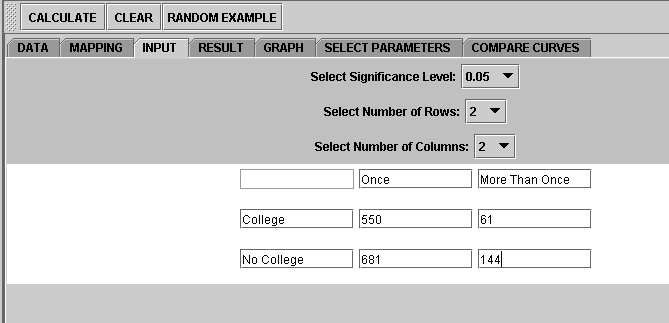
2. Click on "Example 1" button. than the "Data" button to see the data.

3. The data need to be send to the computer for analysis. Click on the "Mapping" button to include the groups you want.


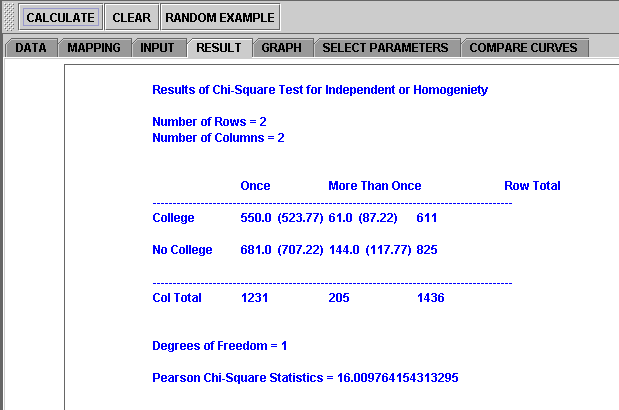
5. Now you're ready to see the results. Just click on the "Result" button.

If you'd like to include some other group(s) or remove the current groups and start over, simply go to the Mapping button and take the groups you want.
Note: if you happen to click on the "Clear" button in the middle of the procedure, all the data will be cleared out. Simply start over from step 1 and reteive the data by click an EXAMPLE button.
Translate this page: