Difference between revisions of "Help pages for SOCR Motion Charts"
m |
m (→How to use the SOCR Motion Charts?) |
||
| Line 19: | Line 19: | ||
** Copy data from any spreadsheet (e.g., [[SOCR_Data]]). | ** Copy data from any spreadsheet (e.g., [[SOCR_Data]]). | ||
* '''Mapping''' | * '''Mapping''' | ||
| − | ** Map your time variable to | + | ** Map your time variable to ''Key'' and any other measurements you are interested in visualizing to the other variables (''X'' and ''Y'' axes, ''color'', ''size'', etc.) ''Category'' is a label for discriminating different blobs (e.g., state, country, geographic unit, etc.) |
* Refer to the [[About_pages_for_SOCR_Chart_List | Complete List of SOCR Charts]] and the [[SOCR_Videos_Charts | Charts Video Tutorials]] | * Refer to the [[About_pages_for_SOCR_Chart_List | Complete List of SOCR Charts]] and the [[SOCR_Videos_Charts | Charts Video Tutorials]] | ||
Revision as of 16:08, 20 January 2009
Contents
SOCR About Pages - SOCR Motion Charts
Introduction
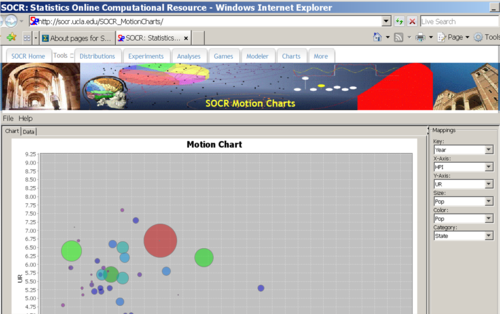
The SOCR Motion Charts provide an interactive and dynamic visualization of temporal and longitudinal data
- This applet allows the visualization of multivariate and high-dimensional data that has a temporal or longitudinal dimension.
- SOCR Motion Charts use categorical, ordinal, nominal, discrete and continuous types of variables.
How to use the SOCR Motion Charts?
- Graph Tab:
- Right click to show the pop-up menu.
- To zoom in: Choose "ZoomIn" from the pop-up menu or hold on the left mouse button and focus on the area you want to zoom in and drag toward lower_right corner.
- To zoom out: Choose "ZoomOut" from the the pop-up menu or hold on the left mouse button and drag toward upper_left corner.
- To change chart properties such as background color, Font, outline stroke: Choose "Properties" from the pop-up menu and make the change to Title/Plot.
- To play the motion chart click Play button. You can also go back and forward using the corresponding buttons.
- Bring mouse over a blob, and/or double-click a blob, to get more information.
- Data Tab:
- Paste data with first row representing the column headings
- Copy data from any spreadsheet (e.g., SOCR_Data).
- Mapping
- Map your time variable to Key and any other measurements you are interested in visualizing to the other variables (X and Y axes, color, size, etc.) Category is a label for discriminating different blobs (e.g., state, country, geographic unit, etc.)
- Refer to the Complete List of SOCR Charts and the Charts Video Tutorials

See also
Translate this page: