Difference between revisions of "SOCR Courses 2009 2010 Stat13 1 Lab5"
(Created page with '== Stats 13.1 - Laboratory Activity 5: Confidence Interval Activity== This is an activity to explore the confidence intervals for the popul…') |
(No difference)
|
Latest revision as of 01:04, 24 November 2009
Contents
Stats 13.1 - Laboratory Activity 5: Confidence Interval Activity
This is an activity to explore the confidence intervals for the population mean when the standard deviation is known.
Description
You can access the applet for the confidence intervals experiment at SOCR Experiments. Use the scroll down button to find the Confidence Interval Experiment.
The confidence interval for the population mean \(\mu\) when \( \sigma \) is known is given by (when n>30)\[ \bar x - z_{\frac{\alpha}{2}} \frac{\sigma}{\sqrt{n}} \le \mu \le \bar x + z_{\frac{\alpha}{2}} \frac{\sigma}{\sqrt{n}} \] where \(z_{\frac{\alpha}{2}}\) is the value of \(z\) such that the area to its left (or right) is \(\frac{\alpha}{2}\). For example if we choose a \(95 \% \) confidence level then \(1-\alpha=0.95\) or \(\alpha=0.05\) and therefore \(\frac{\alpha}{2}=0.025\) which gives \(z_{\frac{\alpha}{2}}=1.96\). The sample mean \(\bar x\) is the mean of the sample of size \(n\), and \(\sigma \) is the standard deviation. In this lab we will generate many confidence intervals based on different sample sizes. The samples in this lab are always selected from the standard normal distribution \(N(0,1)\). Therefore we know that the mean is \(\mu=0\), and the standard deviation \(\sigma=1\). Let's pretend that \(\mu\) is unknown and that only \(\sigma\) is known. We will select many samples each one of size \(n\) and use it to construct a confidence interval for the population mean.
Exercise 1
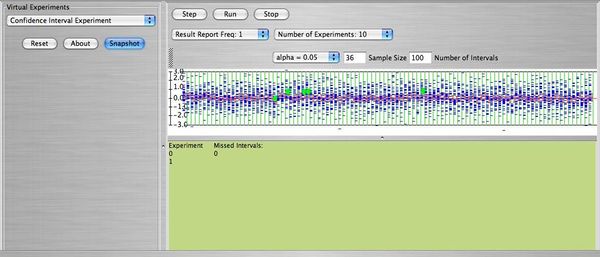
Using the scroll down button select "Number of Experiments = 100". Select sample size \(n=20\), and choose number of intervals 200. It means: You will select 200 samples and with each sample you will obtain a confidence interval. You will do this 100 times. Take a snapshot and answer the following questions.
- How many intervals (out of the 200) do you expect to miss the population mean \(\mu=0\)?
- What do the number -3, -2, -1, 0, 1, 2, 3 represent?
- What do the blue lines represent?
- How is the confidence interval represented?
- What does the green dot represent?
- Write down the formula on which the confidence intervals are based.
Exercise 2
- Reset and repeat Exercise 1, answering questions 1 and 6, with \(\alpha=0.01\). Will the intervals be larger, smaller, or stay the same compared to that of Exercise 1?
- Reset and repeat Exercise 1, answering questions 1 and 6, with sample size now \(n=80\) and \(\alpha=0.01\). Will the intervals be larger, smaller, or stay the same compared to that of Exercise 1?
- Reset and repeat Exercise 1, answering questions 1 and 6, with sample size \(n=80\) and \(\alpha=1.0E-4\) (this is \(10^{-4}\)). Will the intervals be larger, smaller, or stay the same compared to that of Exercise 1?
Below you can see a snapshot of the run of 100 intervals with \( n=36, \ \alpha=0.05 \).

See also
- SOCR Home page: http://www.socr.ucla.edu
Translate this page: