Help pages for SOCR 3D Charts
Contents
SOCR Help Pages - SOCR 3D Charts
Introduction
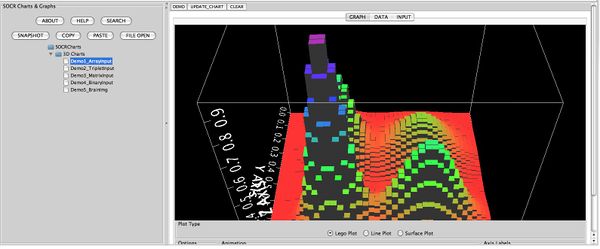
The SOCR 3D Charts provide an interactive and dynamic visualization of spatial, geographic and temporal 2D data.
How to use the SOCR 3D Charts?
- Select a 3D chart from the SOCRCharts list from the left control panel, a demo of the selected chart type will be shown in the right display panel.
- Click on the DATA tab in the right display panel to view the data used in the demo in a table form. The data and the headings are all editable for you to enter your own data.
- After making data changes, click on the UPDATE_CHART button to get the plot updated.
- Click the DEMO' button will reset everything to the demo state.
- Click the CLEAR button will clear all for you to start entering your own data.
Notes:
- You can select table cells and use the COPY/PASTE button to copy/paste data in the data table.
- You also can use the FILE OPEN button to import data into the table cells from a file(Note, the format of the input file should match with the selected demo's input type).
- To add a extra row to the data table, hit "enter" key in the last cell. Hit "tab" key in the last cell will add a extra column.
- To search for a chart from the SOCRCharts list, use the SEARCH button and enter a keyword before click "OK". The related chart in the SOCRCharts list will be highlighted.
- The SNAPSHOT button can be used to save a snapshot of the graph to your own computer.
- To report bugs or make recommendations please visit: SOCR Home Page.
- SOCR3DChart is based on FreeHEP and uses it's rendering engine to render the chart image. See the FreeHEP Java3D for more information.

See also
Translate this page: