Help pages for SOCR Cartography
Contents
SOCR Help Pages - SOCR Cartography and Spatial Statistics
Introduction
The SOCR Cartography and Spatial Statistics Applet provides an interactive and dynamic visualization of spatial, cartographic and GIS data.
How to use the SOCR Motion Charts?
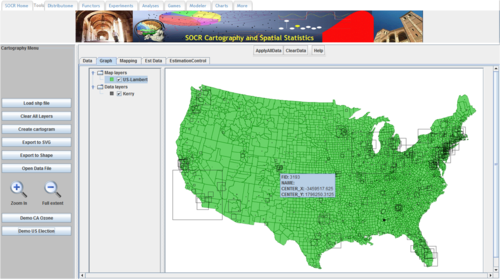
After the applet is loaded, click on one of the demo buttons (here we use the "Demo US Election" as example). A set of shape file will be loaded and drawn as background map, a data file is also loaded. Then the "Graph" tab will be bring to the front, a map of US will be shown in green and one set of data is shown as black square. Move mouse over the map slowly, info about the county or the data will popup.
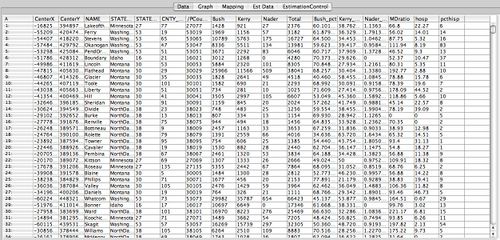
Click "Data" tab, bring the data table to the front view, the first 2 columns are X/Y coordinates.
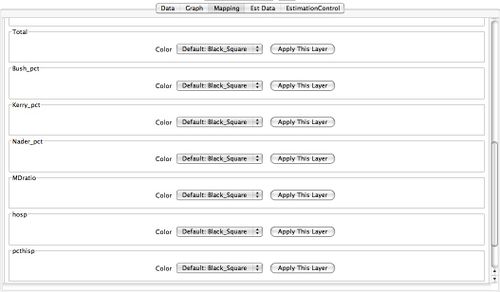
Click "Mapping" tab, all columns in the data table will be listed for mapping except the first 2 columns. The default drawing format is "Black_square", click "Apply This Layer" will put this column of data on the map, you can also choose the "ApplyAllData" button from the top toolbar to draw all data columns. For more color/shape/shadow choice, you can click on the "Color" pull down list to see other options: Color_palette(for single color choice), or Color_Theming(color coded for value).
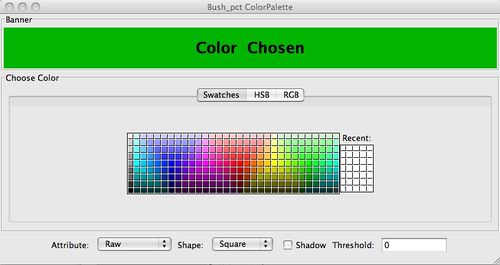
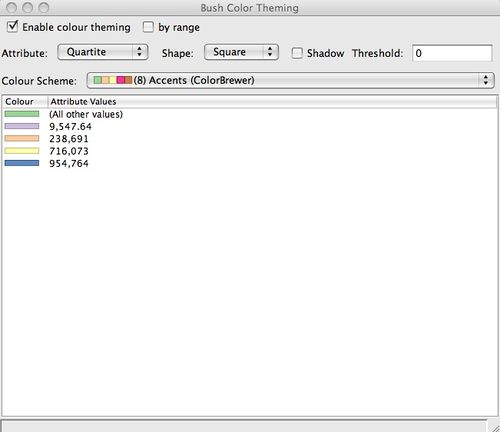
When color_palette is chosen, a popup window will be visible, you can choose color by click on the color squares, and choose "Attribute"(Raw, Normalized, Quartite, Threshold), "Shape"(Square, Triangle,Circle), "Shadow"(on/off), also a text box for you to enter the threshold value.
When color_theming is chosen, a popup window will be visible, check "Enable color theming" first to make your choice visible. You can choose "Attribute"(Raw, Normalized, Quartite, Threshold), "Shape"(Square, Triangle,Circle), "Shadow"(on/off), also a text box for you to enter the threshold value.
How to use the Cartography Morphing Utility
The following protocol demonstrates how to generated a new cartography map by morphing the GIS geometry based on some of the variables contained in the data. These variables must have quantitative values for each of the regions (simple closed polygons) representing the GIS geometric map.
- Start by loading the SOCR Cartography applet
- Load your data (geometry and meta-data) or just use one of the examples (e.g., click the Demo California Ozone button on the left panel)
- Click the Create Cartogram button on the left panel
- Click the Next button twice on the Cartogram Creation Wizard (ScapeToad) Window that pops out
- Select the Cartogram Attribute (quantitative variable that will be used to morph the map) - e.g., choose PERIMETER
- Click the Next button twice
- Finally, clock the Compute button
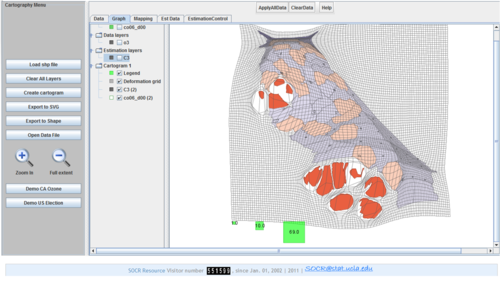
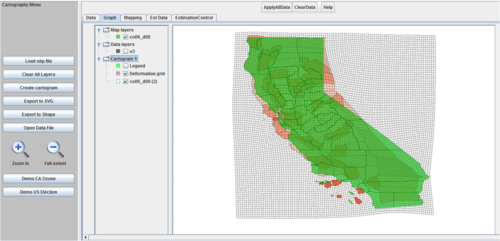
- It may take 1-5 minutes to compute the morph on the map grid. When it finishes, it will generate a new Layer on your Graph tab where the maps are displayed. You can toggle on/off layers to display desired features as shown on the images below.
See also
Translate this page:
