SMHS LinearModeling StatsSoftware
SMHS Linear Modeling - Statistical Software
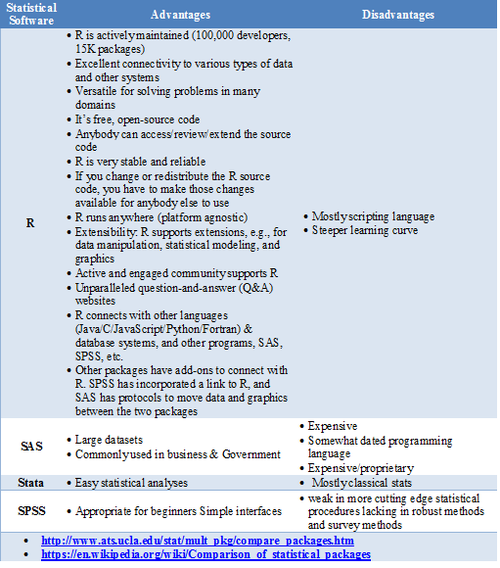
This section briefly describes the pros and cons of different statistical software platforms.
GoogleScholar Research Article Pubs
| Year | R | SAS | SPSS |
|---|---|---|---|
| 1995 | 8 | 8620 | 6450 |
| 1996 | 2 | 8670 | 7600 |
| 1997 | 6 | 10100 | 9930 |
| 1998 | 13 | 10900 | 14300 |
| 1999 | 26 | 12500 | 24300 |
| 2000 | 51 | 16800 | 42300 |
| 2001 | 133 | 22700 | 68400 |
| 2002 | 286 | 28100 | 88400 |
| 2003 | 627 | 40300 | 78600 |
| 2004 | 1180 | 51400 | 137000 |
| 2005 | 2180 | 58500 | 147000 |
| 2006 | 3430 | 64400 | 142000 |
| 2007 | 5060 | 62700 | 131000 |
| 2008 | 6960 | 59800 | 116000 |
| 2009 | 9220 | 52800 | 61400 |
| 2010 | 11300 | 43000 | 44500 |
| 2011 | 14600 | 32100 | 32000 |
require(ggplot2)
require(reshape)
Data_R_SAS_SPSS_Pubs <-read.csv('https://umich.instructure.com/files/522067/download?download_frd=1', header=T)
df <- data.frame(Data_R_SAS_SPSS_Pubs)
# convert to long format
df <- melt(df ,  id.vars = 'Year', variable.name = 'Time')
ggplot(data=df, aes(x=Year, y=value, colour=variable, group = variable)) +  geom_line() + geom_line(size=4) + labs(x='Year', y='Citations')
- SOCR Home page: http://www.socr.umich.edu
Translate this page:

