Help pages for SOCR Cartography
Contents
SOCR Help Pages - SOCR Cartography and Spatial Statistics
Introduction
The SOCR Cartography and Spatial Statistics Applet provides an interactive and dynamic visualization of spatial, cartographic and GIS data.
How to use the SOCR Motion Charts?
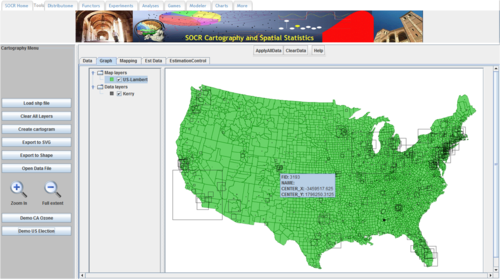
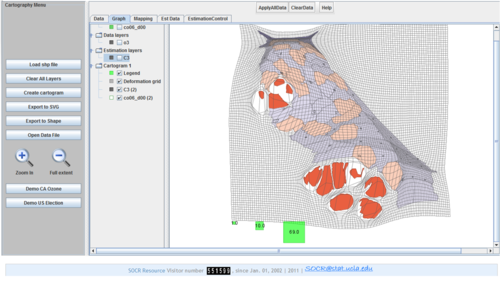
After the applet is loaded, click on one of the demo buttons (here we use the "Demo US Election" as example), the "Graph" tab will be bring to the front, a map of US will be shown in green and one set of data is drawn as black square. Move mouse over the map slowly, info about the county or the data will popup.
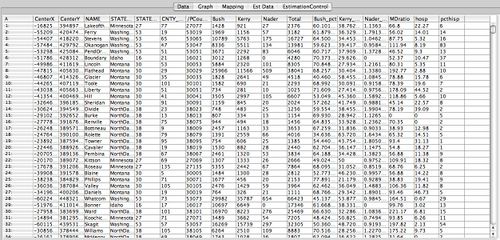
Click "Data" tab, bring the data table to the front view, the first 2 columns are X/Y coordinates.
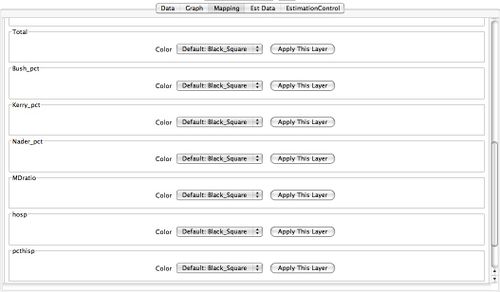
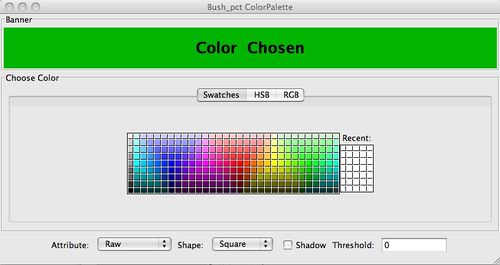
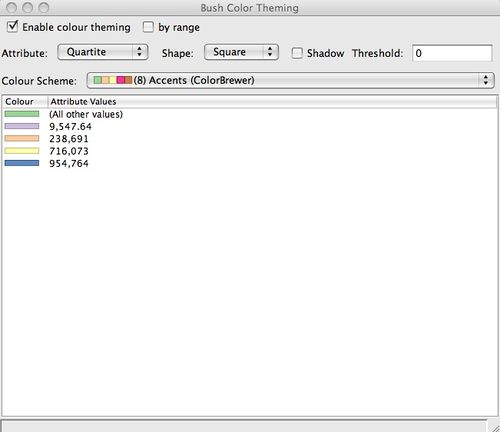
Click "Mapping" tab, all columns in the data table will be listed for mapping except the first 2 columns. The default drawing format is "Black_square", click "Apply This Layer" will put this column of data on the map, you can also choose the "ApplyAllData" button from the top toolbar to draw all data columns. For more color/shape/shadow choice, you can click on the "Color" pull down list to see other options: Color_palette, or Color_Theming.
How to use the Cartography Morphing Utility
See also
Translate this page:
