SOCR MotionCharts LAPopulation
SOCR MotionCharts Activities - LA Neighborhoods Population Data Activity
Goal: Illustrate the use of SOCR Motion Charts using the LA Neighborhoods Data by visualizing relationships between multiple variables.
Data: LA Neighborhoods Data. Data with various geographic and demographics variables including longitude, latitude, median income, and population breakdowns for Los Angeles Neighborhoods.
Activity:
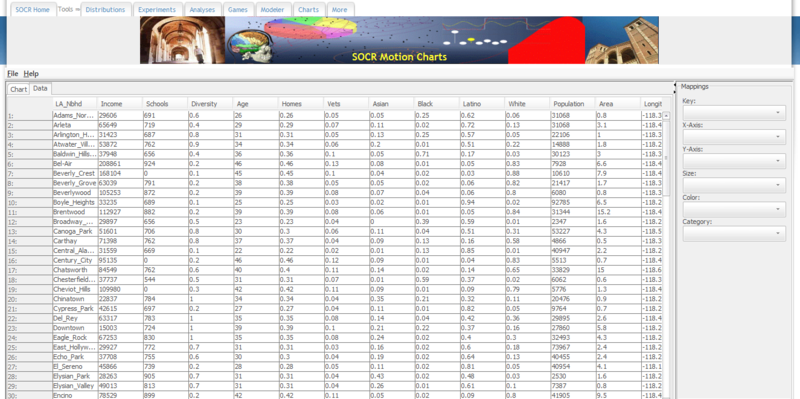
- Go to the LA Neighborhoods Data and find the table with the dataset. Select all of the data, including the headers, and copy it (Ctrl+C on Windows and Command+C on Mac).
- Go to the SOCR Motion Charts: http://socr.ucla.edu/SOCR_MotionCharts/
- Select the "Data" tab, click on the first white cell of the table and paste in the data that we have just copied (Ctrl+V on Windows and Command+V on Mac).
- On the right side of the page, there will be a panel called “mappings” with drop-down menus.
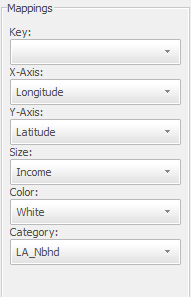
- Key should be your time variable. If you want to see all of the data on the chart at the same time, leave this blank.
- X-axis and Y-axis should be the Longitude and Latitude variables, respectively. Neighborhoods will show up as bubbles on the chart, in the correct geographical locations relative to each other.
- Size is the variable which will govern the size of the bubbles on the chart. We will choose “income” as the size variable. This way, neighborhoods with higher incomes will be represented by a bigger bubble.
- Color is the variable which will govern the color of the bubbles on the chart. We will choose “white” as the color variable. Neighborhoods with high percentages of whites will be red.
- Category is the variable that differentiates the bubbles. We want each bubble to be a different neighborhood, so we choose “LA_Nbhd” for this option.
Our selections for our mappings are as follows:
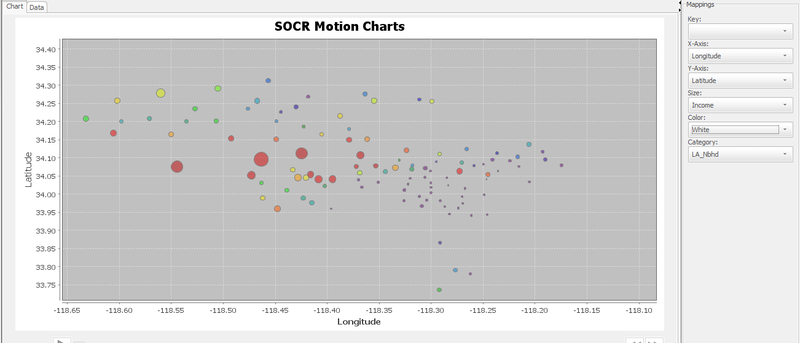
- Now click on the "Chart" tab:
- Each bubble represents one neighborhood. Because we have longitude and latitude data, these bubbles are in the correct geographical locations relative to each other. The larger the bubble, the larger the median income for that neighborhood. Red bubbles are neighborhoods with high percentage of whites. You can mouse over a bubble to see the name of the neighborhood.
- With this Motion Chart we can note some interesting relationships between the variables. Notice that the Westwood bubble is very small, meaning a low median income. This is most likely due to the high percentage of students living there. Also, the three largest red bubbles are the three neighborhoods with the largest median incomes, and they also happen to have the highest percentages of whites. These three neighborhoods are Pacific Palisades, Bel-Air, and Beverly Crest.
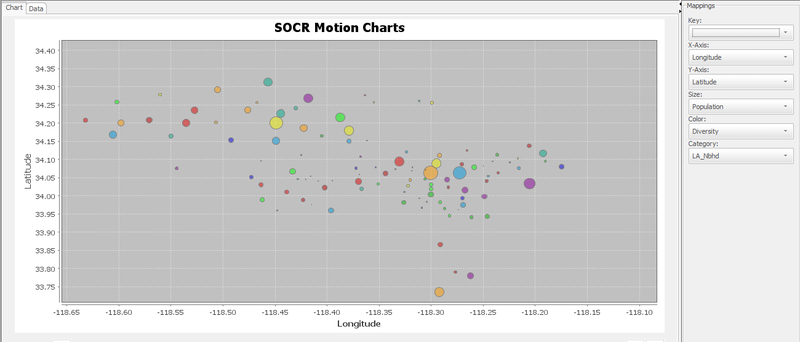
- We can also experiment with other variables. For example, the population could govern the bubble sizes and diversity of the neighborhood could govern the bubble color:
Translate this page:


