SMHS TimeSeriesAnalysis
Scientific Methods for Health Sciences - Time Series Analysis
Questions
• Why are trends, patterns or predictions from models/data important?
• How to detect, model and utilize trends in longitudinal data?
Time series analysis represents a class of statistical methods applicable for series data aiming to extract meaningful information, trend and characterization of the process using observed longitudinal data. These trends may be used for time series forecasting and for prediction of future values based on retrospective observations. Note that classical linear modeling (e.g., regression analysis) may also be employed for prediction & testing of associations using the values of one or more independent variables and their affect the value of another variable. However, time series analysis allows dependencies (e.g., seasonal effects to be accounted for).
Time-series representation
There are 3 (distinct and complementary) types of time series patterns that most time-series analyses are trying to identify, model and analyze. These include:
• Trend: A trend is a long-term increase or decrease in the data that may be linear or non-linear, but is generally continuous (mostly monotonic). The trend may be referred to as direction.
• Seasonal: A seasonal pattern is influence in the data, like seasonal factors (e.g., the quarter of the year, the month, or day of the week), which is always of a fixed known period.
• Cyclic: A cyclic pattern of fluctuations corresponds to rises and falls that are not of fixed period.
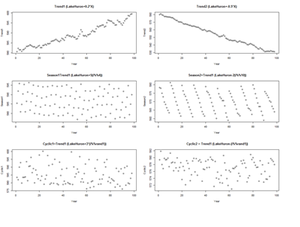
For example, the following code shows several time series with different types of time series patterns.
par(mfrow=c(3,2))
n <- 98
X <- cbind(1:n)   # time points (annually)
Trend1 <- LakeHuron+0.2*X  # series 1
Trend2 <- LakeHuron-0.5*X  # series 2
Season1 <- X; Season2 <- X;  # series 1 & 2
for(i in 1:n) {
Season1[i] <- LakeHuron[i] + 5*(i%%4)
Season2[i] <- LakeHuron[i] -2*(i%%10)
}
Cyclic1 <- X; Cyclic2 <- X;  # series 1 & 2
for(i in 1:n) {
rand1 <- as.integer(runif(1, 1, 10))
Cyclic1[i] <- LakeHuron[i] + 3*(i%%rand1)
Cyclic2[i] <- LakeHuron[i] - 1*(i%%rand1)
}
plot(X, Trend1, xlab="Year",ylab=" Trend1", main="Trend1 (LakeHuron+0.2*X)")
plot(X, Trend2, xlab="Year",ylab=" Trend2" , main="Trend2 (LakeHuron-0.5*X)")
plot(X, Season1, xlab="Year",ylab=" Season1", main=" Season1=Trend1 (LakeHuron+5(i%%4))")
plot(X, Season2, xlab="Year",ylab=" Season2", main=" Season2=Trend1 (LakeHuron-2(i%%10))")
plot(X, Cyclic1, xlab="Year",ylab=" Cyclic1", main=" Cyclic1=Trend1 (LakeHuron+3*(i%%rand1))")
plot(X, Cyclic2, xlab="Year",ylab=" Cyclic2", main=" Cyclic2 = Trend1 (LakeHuron-(i%%rand1))")
Note: If you get this run-time graphics error: “Error in plot.new() : figure margins too large”
You need to make sure your graphics window is large enough or print to PDF:
pdf("myplot.pdf"); plot(x); dev.off()
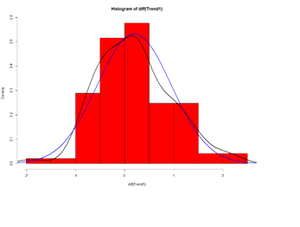
Let’s look at the delta (Δ) changes - Lagged Differences, using diff, which returns suitably lagged and iterated differences.
- Default lag = 1
par(mfrow=c(1,1))
hist(diff(Trend1), prob=T, col="red") # Plot histogram
lines(density(diff(Trend1)),lwd=2) # plot density estimate
x<-seq(-4,4,length=100); y<-dnorm(x, mean(diff(Trend1)), sd(diff(Trend1)))
lines(x,y,lwd=2,col="blue") # plot MLE Normal Fit
Time series decomposition
Denote the time series yt including the three components: a seasonal effect, a trend-cycle effect (containing both trend and cycle), and a remainder component (containing the residual variability in the time series).
Additive model: yt=St+Tt+Et, where yt is the data at period t, St is the seasonal component at period t, Tt is the trend-cycle component at period t and Et is the remainder (error) component at period t. This additive model is appropriate if the magnitude of the seasonal fluctuations or the variation around the trend-cycle does not vary with the level of the time series.
Multiplicative model: yt=St×Tt×Et. When the variation in the seasonal pattern, or the variation around the trend-cycle, are proportional to the level of the time series, then a multiplicative model is more appropriate. Note that when using a multiplicative model, we can transform the data to stabilize the variation in the series over time, and then use an additive model. For instance, a log transformation decomposes the multiplicative model from:
yt=St×Tt×Et
to the additive model:
log(yt)=log(St)+log(Tt)+log(Et).

