SOCR 061708 NC Data Aquifer
Contents
SOCR Datasets - Wolfcamp Aquifer Data
Data Overview
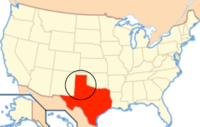
The Wolfcamp aquifer data (Cressie, 1993, pp. 212-214) was acquired by the U.S. Department of Energy in the 1980s to study a nuclear waste site, Deaf Smith County in Texas (bordering New Mexico). The contamination of the aquifer was a concern, and therefore the piezometric-head data were obtained at 85 locations by drilling a narrow pipe through the aquifer.
Data Description
Piezometric head measurements taken at the Wolfcamp Aquifer, Texas, USA. See Cressie (1993, p.212–214) for description of the scientific problem and the data. Original data were converted to SI units: coordinates are given in kilometers and pressure heads measures are in kilometers above the sea level.
- X = Horizontal distance in kilometers from one location (an arbitrary point).
- Y = Vertical distance in kilometers from one location (an arbitrary point).
- Data = Pressure heads measures are in kilometers above the sea level
Data Table
| X | Y | Data |
|---|---|---|
| 42.78275 | 127.62282 | 1.464 |
| -27.39691 | 90.78732 | 2.553 |
| -1.16289 | 84.896 | 2.158 |
| -18.61823 | 76.45199 | 2.455 |
| 96.46549 | 64.58058 | 1.756 |
| 108.56243 | 82.92325 | 1.702 |
| 88.36356 | 56.45348 | 1.805 |
| 90.04213 | 39.2582 | 1.797 |
| 93.17269 | 33.05852 | 1.714 |
| 97.61099 | 56.27887 | 1.466 |
| 90.62946 | 35.08169 | 1.729 |
| 92.55262 | 41.75238 | 1.638 |
| 99.48996 | 59.15785 | 1.736 |
| -24.06744 | 184.76636 | 1.476 |
| -26.06285 | 114.07479 | 2.2 |
| 56.27842 | 26.84826 | 1.999 |
| 73.03881 | 18.8814 | 1.68 |
| 80.26679 | 12.61593 | 1.806 |
| 80.23009 | 14.61795 | 1.682 |
| 68.83845 | 107.77423 | 1.306 |
| 76.39921 | 95.9938 | 1.722 |
| 64.46148 | 110.39641 | 1.437 |
| 43.39657 | 53.61499 | 1.828 |
| 39.07769 | 61.99805 | 2.118 |
| 112.8045 | 45.54766 | 1.725 |
| 54.25899 | 147.81987 | 1.606 |
| 6.13202 | 48.32772 | 2.648 |
| -3.80469 | 40.4045 | 2.56 |
| -2.23054 | 29.91113 | 2.544 |
| -2.36177 | 33.82002 | 2.386 |
| -2.1889 | 33.68207 | 2.4 |
| 63.22428 | 79.49924 | 1.757 |
| -10.7786 | 175.11346 | 1.402 |
| -18.98889 | 171.91695 | 1.364 |
| -38.57884 | 158.52742 | 1.735 |
| 83.14496 | 159.11559 | 1.376 |
| -21.80248 | 15.02551 | 2.729 |
| -23.56457 | 9.41441 | 2.766 |
| -20.11299 | 22.09269 | 2.736 |
| -16.62654 | 17.25621 | 2.432 |
| 29.90748 | 175.12875 | 1.024 |
| 100.91568 | 22.97808 | 1.611 |
| 101.29544 | 22.96385 | 1.548 |
| 103.26625 | 20.34239 | 1.591 |
| -14.31073 | 31.26545 | 2.54 |
| -18.13447 | 30.18118 | 2.352 |
| -18.12151 | 29.53241 | 2.528 |
| -9.88796 | 38.14483 | 2.575 |
| -12.16336 | 39.11081 | 2.468 |
| 11.65754 | 18.73347 | 2.646 |
| 61.69122 | 32.94906 | 1.739 |
| 69.57896 | 33.80841 | 1.674 |
| 66.72205 | 33.93264 | 1.868 |
| -36.65446 | 150.91457 | 1.865 |
| -19.55102 | 137.78404 | 1.777 |
| -21.29791 | 131.82542 | 1.579 |
| -22.36166 | 137.1368 | 1.771 |
| 21.14719 | 139.26199 | 1.408 |
| 7.68461 | 126.83751 | 1.527 |
| -8.33227 | 107.77691 | 2.003 |
| 56.70724 | 171.26443 | 1.386 |
| 59.00052 | 164.54863 | 1.089 |
| 68.96893 | 177.2482 | 1.384 |
| 70.90225 | 161.38136 | 1.03 |
| 73.00243 | 162.98959 | 1.092 |
| 59.66237 | 170.10544 | 1.161 |
| 61.87249 | 174.30177 | 1.415 |
| 63.7081 | 173.91454 | 1.231 |
| 5.62706 | 79.0873 | 2.3 |
| 18.24739 | 77.39191 | 2.238 |
| 85.68824 | 139.81702 | 1.038 |
| 105.07646 | 132.03181 | 1.332 |
| -101.64278 | 10.65106 | 3.51 |
| -145.23654 | 28.02333 | 3.49 |
| -73.99313 | 87.9727 | 2.594 |
| -94.48182 | 86.62606 | 2.65 |
| -88.84983 | 76.70991 | 2.533 |
| -120.25898 | 80.76485 | 3.571 |
| -86.02454 | 54.36334 | 2.811 |
| -72.79097 | 43.09215 | 2.728 |
| -100.17372 | 42.89881 | 3.136 |
| -78.83539 | 40.82141 | 2.553 |
| -83.69063 | 46.50482 | 2.798 |
| -95.61661 | 35.82183 | 2.691 |
| -87.5548 | 29.39267 | 2.946 |
References
- Cressie, N.A.C (1993) Statistics for Spatial Data. New York: Wiley.
- Papritz, A. and Moyeed, R. (2001) Parameter uncertainty in spatial prediction: checking its importance by cross-validating the Wolfcamp and Rongelap data sets. GeoENV 2000: Geostatistical for Environmental Applications. Ed. P. Monestiez, D. Allard, R. Froidevaux. Kluwer.
"-----
Translate this page:
