SOCR EduMaterials Activities BirthdayExperiment
The Birthday Experiment
*Description:
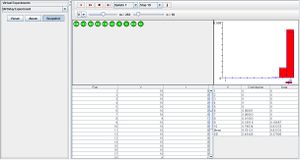
From a population of size m, individual balls are numbered 1 to m. A random sample of size n with replacement is drawn during every run. V is the random variables of interest which represent the number of distinct values in the sample, and I represents the indicator variable that specifies at least one duplicate in the sample. In the data table below, the values of V and I are recorded after every trial. Above the data table are the sampled balls in which red symbolizes a duplicate ball within the trial and green as balls that have not been previously chosen. On the upper right is a graph that illustrates the probability density function in blue and the empirical density function in red. The numerical values are recorded in the distribution table. Parameters m and n can be modified to the experimenter’s discretion by using the scroll bars. Note: interested if a match has occurred (I=1)
*Goal:
The purpose of this experiment is to draw attention toward the behaviors of random sampling with replacement.
*Experiment:
Go to the SOCR Experiments [[1]] and select the Birthday Experiment from the drop-down list of experiments on the top left. The image below shows the initial view of this experiment:

When pressing the play button, one trial will be executed and recorded in the distribution table below. The fast forward button symbolizes the nth number of trials to be executed each time. The stop button ceases any activity and is helpful when the experimenter chooses “continuous,” indicating an infinite number of events. The fourth button will reset the entire experiment, deleting all previous information and data collected. The “update” scroll indicates nth number of trials (1, 10, 100, or 1000) performed when selecting the fast forward button and the “stop” scroll indicates the maximum number of trials in the experiment.
When data is drawn according to I, as value of m increases, the probability density function graph for 1 decreases and the probability density function graph of 0 increases. As the value of n increases, the probability density graph for 1 increases and the probability density graph for 0 decreases.

When variable V is the chosen element of interest, the probability density function is skewed left when m is large. Modifying n changes the spread of the graph—a large value of n gives small values on the y-axis and large distribution on x-axis while a small value of n gives large values on the y-axis and small distribution on x-axis.

As the number of trials increase, the empirical density function graph in red begins to look more similar to the probability density graph in blue.
*Applications:
The Birthday Experiment may be used for many different types of events that involve selecting individual elements from a large population. For example, setting variable V as the desired event in the Birthday Experiment may represent a quality (e.g. birth date, age, height, etc.) for every person in a city. Similarly, variable I may represent two distinct variables that are being represented (e.g. gender, left/right-handed, married/single, etc.). Note that the probability density graph could be symbolized as a hypothesis in this experiment.