SOCR EduMaterials Activities 2D CategoryStepChart
Contents
CATEGORY STEP CHART
Summary
This activity describes the construction of the category step chart in SOCR. The applets can be accessed at SOCR Charts under the Miscellaneous folder.
Goals
The aims of this activity are to:
- show the usefulness of category step chart
- create better understanding of the category step chart by users following descriptions, examples, and exercises
- connect the category step chart with daily activities
Background
The Category Step Chart is one way to display trends visually. It is often useful for averages over a time period.
For references, visit Step Charts for Excel and Step Charts.
Description
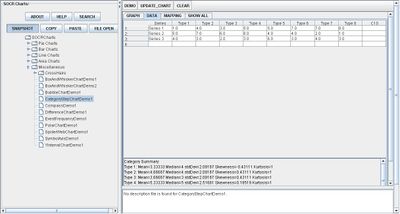
Go to the SOCR Charts and select Miscellaneous from the items located on the left, then select Category Step Chart Demo. In the Demo1 box plot, we can see side-by-side box plots of two categories for each of three series. These demonstration data can be viewed by clicking on DATA. Clicking on MAPPING you can choose the variables. Clicking on SHOW ALL the applet will present the graph, the data, and the mapping environment. Let’s clear this data set (click on CLEAR) so that we can enter our own data. After you click on CLEAR button, click on the DATA tab to enter data into the spreadsheet. The following data will be entered (don’t forget to separate the data by commas!):

The image above is a basic demonstration of Category Step Chart. Note that there are three separate graphs on the chart, each with its own trend.
- Exercise 1: Look into the probability of undergraduate acceptance rate at a local college. Display the results with the category step chart.
- Questions:
- Can any conclusions be made with a category step chart?
- Under what circumstances may variables be independent or dependent?
- Give a case in which a category step chart may not be useful, but another type of chart is.
- Can data information drawn from a quantitative experiment be displayed with the category step chart?
Data Type and Format
By clicking Data between the Graph and Mapping button, it allows users to input or vary the values of the data set. Numerical values are only required to create Category Step Charts. Users should input the data values in the corresponding categorical event as the image below demonstrates this:

Applications
One of the most persuasive elements when proposing data and literature to others is a well-designed chart presentation.
Researchers may utilize the Category Step Chart for specific trends of natural characteristics during a period of time. For example, the trends of humidity or temperature for every decade in a century.
Scientists may also use this application to easily display their results of trends in bacteria growth over a given period of time.
Translate this page: