SOCR EduMaterials Activities BaseballSalaryWins
Contents
[hide]SOCR Educational Materials - Activities - SOCR Baseball Payroll and Team Success Activity
Summary
This activity will center around investigating how a MLB team's payroll correlates with success. The first step is to use simple regression to compare wins to payroll each year and overall. To do this, go to the mapping tab and select each year's payroll as the independent variable with the corresponding year's wins as the dependent variable.
Goals
The aims of this activity are to:
- investigate whether baseball salaries and team wins or losses are correlated.
- demonstrate the use of several SOCR exploratory and quantitative data analysis tools (e.g., SOCR analyses, SOCR charts).
- explore the relations between multiple variables.
Data
These data are collected from the following resources: Baseball Payroll, 2008, 2009, and 2010 standings.
| Team | League | 2010Wins | 2010Losses | 2010W-L% | 2010Runs | 2010RunsAgainst | 2010Rundiff | 2010Payroll | 2009Wins | 2009Losses | 2009W-L% | 2009Runs | 2009RunsAgainst | 2009Rundiff | 2009Payroll | 2008Wins | 2008Losses | 2008W-L% | 2008Runs | 2008RunsAgainst | 2008Rundiff | 2008Payroll | TotalWins | TotalPayroll |
|---|---|---|---|---|---|---|---|---|---|---|---|---|---|---|---|---|---|---|---|---|---|---|---|---|
| PHI | NL | 97 | 65 | 0.599 | 4.8 | 4 | 0.8 | 141927381 | 93 | 69 | 0.574 | 5.1 | 4.4 | 0.7 | 113004048 | 92 | 70 | 0.568 | 4.9 | 4.2 | 0.7 | 98269880 | 282 | 353201309 |
| TBR | AL | 96 | 66 | 0.593 | 5 | 4 | 0.9 | 71923471 | 84 | 78 | 0.519 | 5 | 4.7 | 0.3 | 63313035 | 97 | 65 | 0.599 | 4.8 | 4.1 | 0.6 | 43820597 | 277 | 179057103 |
| NYY | AL | 95 | 67 | 0.586 | 5.3 | 4.3 | 1 | 206333389 | 103 | 59 | 0.636 | 5.6 | 4.6 | 1 | 201449289 | 89 | 73 | 0.549 | 4.9 | 4.5 | 0.4 | 209081577 | 287 | 616864255 |
| MIN | AL | 94 | 68 | 0.58 | 4.8 | 4.1 | 0.7 | 97559167 | 87 | 76 | 0.534 | 5 | 4.7 | 0.3 | 65299267 | 88 | 75 | 0.54 | 5.1 | 4.6 | 0.5 | 56932766 | 269 | 219791200 |
| SFG | NL | 92 | 70 | 0.568 | 4.3 | 3.6 | 0.7 | 97828833 | 88 | 74 | 0.543 | 4.1 | 3.8 | 0.3 | 82161450 | 72 | 90 | 0.444 | 4 | 4.7 | -0.7 | 76594500 | 252 | 256584783 |
| CIN | NL | 91 | 71 | 0.562 | 4.9 | 4.2 | 0.6 | 72386544 | 78 | 84 | 0.481 | 4.2 | 4.5 | -0.3 | 70968500 | 74 | 88 | 0.457 | 4.3 | 4.9 | -0.6 | 74117695 | 243 | 217472739 |
| ATL | NL | 91 | 71 | 0.562 | 4.6 | 3.9 | 0.7 | 84423667 | 86 | 76 | 0.531 | 4.5 | 4 | 0.6 | 96726167 | 72 | 90 | 0.444 | 4.6 | 4.8 | -0.2 | 102365683 | 249 | 283515517 |
| TEX | AL | 90 | 72 | 0.556 | 4.9 | 4.2 | 0.6 | 55250545 | 87 | 75 | 0.537 | 4.8 | 4.6 | 0.3 | 68646023 | 79 | 83 | 0.488 | 5.6 | 6 | -0.4 | 67712326 | 256 | 191608894 |
| SDP | NL | 90 | 72 | 0.556 | 4.1 | 3.6 | 0.5 | 37799300 | 75 | 87 | 0.463 | 3.9 | 4.7 | -0.8 | 42796700 | 63 | 99 | 0.389 | 3.9 | 4.7 | -0.8 | 73677616 | 228 | 154273616 |
| BOS | AL | 89 | 73 | 0.549 | 5 | 4.6 | 0.5 | 162747333 | 95 | 67 | 0.586 | 5.4 | 4.5 | 0.8 | 122696000 | 95 | 67 | 0.586 | 5.2 | 4.3 | 0.9 | 133390035 | 279 | 418833368 |
| CHW | AL | 88 | 74 | 0.543 | 4.6 | 4.3 | 0.3 | 108273197 | 79 | 83 | 0.488 | 4.5 | 4.5 | 0 | 96068500 | 89 | 74 | 0.546 | 5 | 4.5 | 0.5 | 121189332 | 256 | 325531029 |
| STL | NL | 86 | 76 | 0.531 | 4.5 | 4 | 0.6 | 93540753 | 91 | 71 | 0.562 | 4.5 | 4 | 0.6 | 88528411 | 86 | 76 | 0.531 | 4.8 | 4.5 | 0.3 | 99624449 | 263 | 281693613 |
| TOR | AL | 85 | 77 | 0.525 | 4.7 | 4.5 | 0.2 | 62689357 | 75 | 87 | 0.463 | 4.9 | 4.8 | 0.2 | 80993657 | 86 | 76 | 0.531 | 4.4 | 3.8 | 0.6 | 97793900 | 246 | 241476914 |
| COL | NL | 83 | 79 | 0.512 | 4.8 | 4.4 | 0.3 | 84227000 | 92 | 70 | 0.568 | 5 | 4.4 | 0.5 | 75201000 | 74 | 88 | 0.457 | 4.6 | 5.1 | -0.5 | 68655500 | 249 | 228083500 |
| OAK | AL | 81 | 81 | 0.5 | 4.1 | 3.9 | 0.2 | 51654900 | 75 | 87 | 0.463 | 4.7 | 4.7 | 0 | 62310000 | 75 | 86 | 0.466 | 4 | 4.3 | -0.3 | 47967126 | 231 | 161932026 |
| DET | AL | 81 | 81 | 0.5 | 4.6 | 4.6 | 0 | 122864929 | 86 | 77 | 0.528 | 4.6 | 4.6 | 0 | 115085145 | 74 | 88 | 0.457 | 5.1 | 5.3 | -0.2 | 137685196 | 241 | 375635270 |
| FLA | NL | 80 | 82 | 0.494 | 4.4 | 4.4 | 0 | 55641500 | 87 | 75 | 0.537 | 4.8 | 4.7 | 0 | 36814000 | 84 | 77 | 0.522 | 4.8 | 4.8 | 0 | 21811500 | 251 | 114267000 |
| LAA | AL | 80 | 82 | 0.494 | 4.2 | 4.3 | -0.1 | 105013667 | 97 | 65 | 0.599 | 5.5 | 4.7 | 0.8 | 113709000 | 100 | 62 | 0.617 | 4.7 | 4.3 | 0.4 | 119216333 | 277 | 337939000 |
| LAD | NL | 80 | 82 | 0.494 | 4.1 | 4.3 | -0.2 | 94945517 | 95 | 67 | 0.586 | 4.8 | 3.8 | 1 | 100458101 | 84 | 78 | 0.519 | 4.3 | 4 | 0.3 | 118588536 | 259 | 313992154 |
| NYM | NL | 79 | 83 | 0.488 | 4 | 4 | 0 | 132701445 | 70 | 92 | 0.432 | 4.1 | 4.7 | -0.5 | 135773988 | 89 | 73 | 0.549 | 4.9 | 4.4 | 0.5 | 137793376 | 238 | 406268809 |
| MIL | NL | 77 | 85 | 0.475 | 4.6 | 5 | -0.3 | 81108279 | 80 | 82 | 0.494 | 4.8 | 5 | -0.2 | 80257502 | 90 | 72 | 0.556 | 4.6 | 4.3 | 0.4 | 80937499 | 247 | 242303280 |
| HOU | NL | 76 | 86 | 0.469 | 3.8 | 4.5 | -0.7 | 92355500 | 74 | 88 | 0.457 | 4 | 4.8 | -0.8 | 102996415 | 86 | 75 | 0.534 | 4.4 | 4.6 | -0.2 | 88930414 | 236 | 284282329 |
| CHC | NL | 75 | 87 | 0.463 | 4.2 | 4.7 | -0.5 | 146859000 | 83 | 78 | 0.516 | 4.4 | 4.2 | 0.2 | 135050000 | 97 | 64 | 0.602 | 5.3 | 4.2 | 1.1 | 118345833 | 255 | 400254833 |
| CLE | AL | 69 | 93 | 0.426 | 4 | 4.6 | -0.7 | 61203967 | 65 | 97 | 0.401 | 4.8 | 5.3 | -0.6 | 81625567 | 81 | 81 | 0.5 | 5 | 4.7 | 0.3 | 78970066 | 215 | 221799600 |
| WSN | NL | 69 | 93 | 0.426 | 4 | 4.6 | -0.5 | 61425000 | 59 | 103 | 0.364 | 4.4 | 5.4 | -1 | 59328000 | 59 | 102 | 0.366 | 4 | 5.1 | -1.1 | 54961000 | 187 | 175714000 |
| KCR | AL | 67 | 95 | 0.414 | 4.2 | 5.2 | -1 | 72267710 | 65 | 97 | 0.401 | 4.2 | 5.2 | -1 | 70908333 | 75 | 87 | 0.463 | 4.3 | 4.8 | -0.6 | 58245500 | 207 | 201421543 |
| BAL | AL | 66 | 96 | 0.407 | 3.8 | 4.8 | -1.1 | 81612500 | 64 | 98 | 0.395 | 4.6 | 5.4 | -0.8 | 67101667 | 68 | 93 | 0.422 | 4.9 | 5.4 | -0.5 | 67196246 | 198 | 215910413 |
| ARI | NL | 65 | 97 | 0.401 | 4.4 | 5.2 | -0.8 | 60718167 | 70 | 92 | 0.432 | 4.4 | 4.8 | -0.4 | 73571667 | 82 | 80 | 0.506 | 4.4 | 4.4 | 0.1 | 66202712 | 217 | 200492546 |
| SEA | AL | 61 | 101 | 0.377 | 3.2 | 4.3 | -1.1 | 98376667 | 85 | 77 | 0.525 | 4 | 4.3 | -0.3 | 98904167 | 61 | 101 | 0.377 | 4.1 | 5 | -0.9 | 117666482 | 207 | 314947316 |
| PIT | NL | 57 | 105 | 0.352 | 3.6 | 5.3 | -1.7 | 34943000 | 62 | 99 | 0.385 | 4 | 4.8 | -0.8 | 48743000 | 67 | 95 | 0.414 | 4.5 | 5.5 | -0.9 | 48689783 | 186 | 132375783 |
Data Analysis
Exploratory data analysis (EDA)
The correlations between payroll and team success for 2008, 2009, 2010, and overall are 0.327, 0.501, 0.349, and 0.520, respectfully. This indicates that the strength of the relationship varies from year to year.

Quantitative data analysis (QDA)
ANOVA
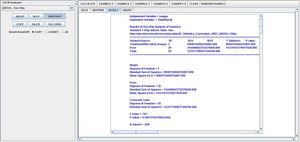
The next step is to compare the average payroll each year in the American League and National League. To do this, use ANOVA and select league as the independent variable and each year's payroll as the dependent variable. The p-value for each year is 0.328 for 2008, 0.442 for 2009, 0.434 for 2010 and 0.381 overall. This suggests that there is no significant difference between the two leagues.

T-Test
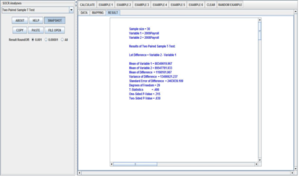
Another thing to check is how the average payroll changed from year to year. To do this, select the Two-paired sample T test and choose 2008 and 2009 as the variables, then repeat with 2009 and 2010 as the variables. The test for 2008 and 2009 has a p-value of .315. The test for 2009 and 2010 has a p-value of .167. This means there isn't evidence of a significant increase in payroll each year.

Multiple linear regression
As a team's record is heavily influenced by the number of runs they score and the number of runs they allow, it would be interesting to check the relationship between each of those and wins as well as the relationship between them and payroll. To do this, first use multiple regression with wins each year as the dependent variable and runs and runs against the independent variables.

Conclusion
- For 2008, the slope estimates are 17.421 for runs and -16.904 for runs against. For 2009, the slope estimates are 15.715 for runs and -19.459 for runs against. For 2010, the slope estimates are 15.538 for runs and -14.809 for runs against. This suggests that scoring more runs was slightly more important in 2008 and 2010 while allowing fewer runs was more important in 2009. Next, use simple regression to compare the correlation and plot the relationship between payroll and runs and between payroll and runs against each year.

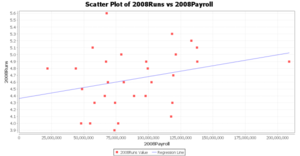
- In 2008, the correlation between payroll and runs was .281, and the correlation between payroll and runs against was -.261. For 2009 they were .372 and -.290 respectively. For 2010 they were .364 and -.111 respectively. This suggests that it is easier to use payroll spending improve hitting than it is to improve pitching. This suggests that the ability to still get good pitching is what allows some teams with lower payrolls to remain competitive.
See also
- SOCR Home page: http://www.socr.ucla.edu
Translate this page:


