SOCR EduMaterials Activities BoxAndWhiskerChart
Contents
[hide]BOX AND WHISKER CHART
Background
The Box and Whisker Chart is often used in Statistical data as it easily demonstrates the range, standard deviation, mean, and quartiles of the values. When comparing statistical data, Box and Whisker Charts are very useful.
For references: Box And Whisker Plot, Box And Whisker Chart, Wikipedia
Description
Go to the SOCR Charts and select Miscellaneous from the items located on the left, then select Box and Whisker Chart Demo:

The image above is a basic demonstration of the Box and Whisker plot.
Note that all the Statistical data are marked on the graph – quartiles, median, range, etc.
Box and Whisker Charts may also be horizontal as shown in the other demonstration.
Data Type and Format
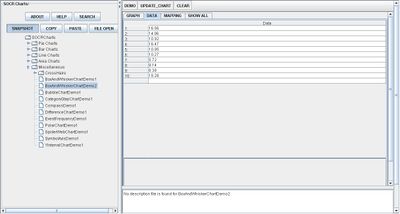
By selecting Data between the Graph and Mapping button, it allows users to input or vary the values of the data set. The only type of variable needed to produce Box and Whisker Charts is the numerical values of the data set. Once entered in the columns of the data table, SOCR applets will automatically calculate the mean and standard deviation of the values in order to create a Box and Whisker Chart. The image below shows how the data values may be added into the applet:

Applications
One of the most persuasive elements when proposing data and literature to others is a well-designed chart presentation.
Engineers may use the Box and Whisker Chart when comparing the efficiency of specific building materials. Utilizing this type of chart will give engineers the ability to compare the strength by looking at the mean and standard deviations of the materials.
Doctors and nurses may also use the Box and Whisker Chart to compare the effect of different types of pain killers.
Translate this page: