SOCR EduMaterials Activities Discrete Distributions
This is an activity to explore the Normal Probability Distribution and the normal approximation to binomial.
- Description: You can access the applets for the above distributions at http://www.socr.ucla.edu/htmls/SOCR_Distributions.html .
- Exercise 1: Use SOCR to graph and print the distribution of \( X \sim N(20, 3) \). Show on the graph the following points\[\mu \pm 1 \sigma, \mu \pm 2 \sigma, \mu \pm 3 \sigma \]. How many standard deviations from the mean is the value \( x=27.5 \)?
- Exercise 2: Graph the distribution of \( X \sim N(40, 10)\).
- 1. Find \(P(X>49) \) Submit a printout.
- 2. Find \(P(X<22) \) Submit a printout.
- 3. Find \(P(X<58) \) Submit a printout.
- 4. Find \(P(X>13) \) Submit a printout.
- 5. Find \(P(12<X<37) \) Submit a printout.
- 6. Find \(P(33<X<60) \) Submit a printout.
- 7. Find \(P(52<X<65) \) Submit a printout.
- 8. Use the mouse or the left cut off or right cut off points to find the \(8^{th}, 20^{th}, 45^{th}, 55^{th}, 70^{th}, 95^{th}\) percentiles. After you find these percentiles you can place by hand all of them in one printout (or you can submit a printout for each one of them if you want).
- 9. Make sure you know how to answer the above questions using the \(z\) score \(z=\frac{x-\mu}{\sigma}\) and your \(z\) table from the handout! You do not need to submit anything here.
- 10. The lifetime of tires of brand \(A\) follows the normal distribution with mean 40000 miles and standard deviation 4000 miles.
- 1. Use \(SOCR\) to find the probability that a tire will last between 40000 and 46000 miles.
- 2. Given that a tire will last more than 46000 miles what is the probability that it will last more than 50000 miles? Submit a printout and explain how you get the answer.
- 3. Given that a tire will last more than 46000 miles what is the probability that it will last less than 50000 miles? Submit a printout and explain how you get the answer.
\end{itemize}
- 4. The probability that a student is admitted in the Math Department Major at a college is \(30 \%\). Suppose that this year 150 students will apply for admission into the Math major.
- 5. What is the distribution of the number of students admitted? Use \(SOCR\) to graph and print this distribution. What is the shape of this distribution? What is the mean and standard deviation of this distribution?
- 6. Write an expression for the exact probability that among the 150 students at least 55 will be admitted.
- 7. Use SOCR to compute the probability of part (2).
- 8. Use the normal distribution to approximate the probability of part (2) (do not forget the continuity correction). What is the error of the approximation?
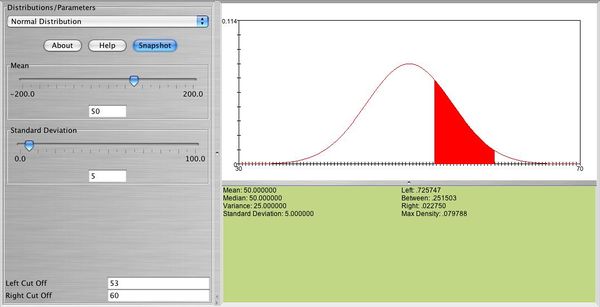
Below you can see the distribution of a normal random variable \( X \) with \( \mu=50, \sigma=5 \). In this graph you can also see the probability that \( X \) is between 53 and 60.

- SOCR Home page: http://www.socr.ucla.edu
Translate this page:
</math>