SOCR EduMaterials Activities LawOfLargeNumbersExperiment
Law of Large Numbers Experiment
Description
This activity is part of the General Law of Large Numbers Experiment. The Law of Large Numbers demonstrates a Coin Toss experiment that shows interactively the Law of Large Numbers and several of its misconceptions, in the case of studying the population proportion of heads in a coin-toss experiment (using sample proportions). The complete description of the LLN may be found online at the SOCR website SOCR_EduMaterials_Activities_LawOfLargeNumbers.
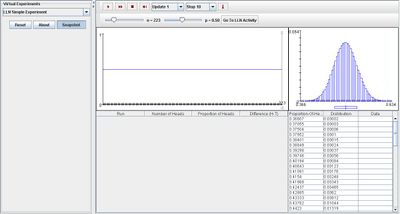
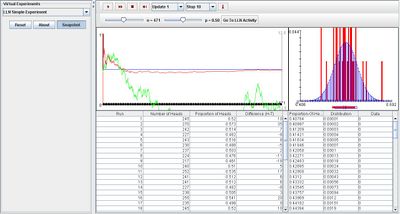
The user may select n, the sample size, and p, the probability of heads. The graph panel on the top left show the sample proportion of heads in red and the differences between heads and tails. The graph on the right illustrates the theoretical and the sample distributions of the proportion of heads.
Goal
To provide a simulation for Law of Large Numbers by manipulating the simple Coin-Toss Experiment, and assist users to gain a better understanding of the LLN.
Experiment
Go to the SOCR Experiment and select the Law of Large Numbers Experiment from the drop-down list of experiments on the top left. The image below shows the initial view of this experiment:

When pressing the play button, one trial will be executed and recorded in the distribution table below. The fast forward button symbolizes the nth number of trials to be executed each time. The stop button ceases any activity and is helpful when the experimenter chooses “continuous,” indicating an infinite number of events. The fourth button will reset the entire experiment, deleting all previous information and data collected.
The “update” scroll indicates nth number of trials (1, 10, 100, or 1000) performed when selecting the fast forward button and the “stop” scroll indicates the maximum number of trials in the experiment.
Since parameter p represent the probability of heads, increasing it would cause the probability density graph to be shifted upwards and decreasing it would shift it downwards in the top left graph. The graph to the right will remain normal. The image shown below demonstrates this property of the experiment:

Note that the red streak in the top left graph will always be similar to the blue distribution graph and the green streak will seem random. The image below shows this:

Applications
The Law of Large Numbers illustrates the statement and validity of tossing coins repeatedly. In this experiment, two random variables are associated with this process. The first variable will be the proportion of heads and the second will be the differences in the number of heads and tails. The outcome of this experiment may be used as a summarization of processing these types of experiments using computational resources. It may also be used in other types of situations:
The average weight of soda cans is marked 8 ounces in every box of 32 cans. The average weight of 10 cans from the box is most likely closer to the real average of all of the cans in the box than randomly selecting 3 cans. This happens because 10 is a larger number than the sample of 3 which will have a better representation of the entire box.
Translate this page: