SOCR EduMaterials Activities TwoDimensionalPoissonExperiment
Contents
[hide]Two Dimensional Poisson Experiment
Description
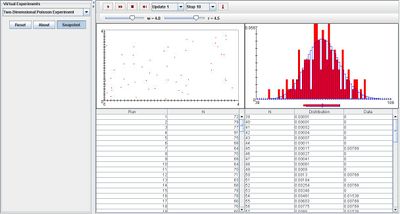
The experiment is to run a Poisson process in the plane, and record the number of points N in the square [0,W] x [0,W]. The points are shown as red dots in the scatter plot. The number of points N is recorded on each update. The density and moments of N are shown in blue in the distribution graph and are recorded in the distribution table. On each update, the empirical density of N is shown in red in the distribution graph and is recorded in the distribution table. The parameters of the experiment are the rate r of the process and the side length W of the square, which can be varied with scroll bars.
Goal
To provide a simulation demonstrating properties of the Poisson distribution using the finite difference numerical method, and to assist others in developing a better understanding of the two dimensional Poisson process.
Experiment
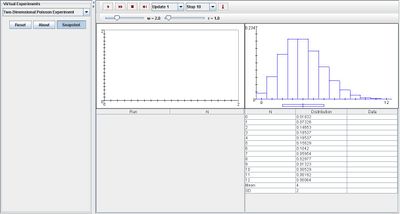
Go to the SOCR Experiment and select the Two-Dimensional Poisson Experiment from the drop-down list of experiments on the top left. The image below shows the initial view of this experiment:

When pressing the play button, one trial will be executed and recorded in the distribution table below. The fast forward button symbolizes the nth number of trials to be executed each time. The stop button ceases any activity and is helpful when the experimenter chooses “continuous,” indicating an infinite number of events. The fourth button will reset the entire experiment, deleting all previous information and data collected.
The “update” scroll indicates nth number of trials (1, 10, 100, or 1000) performed when selecting the fast forward button and the “stop” scroll indicates the maximum number of trials in the experiment.
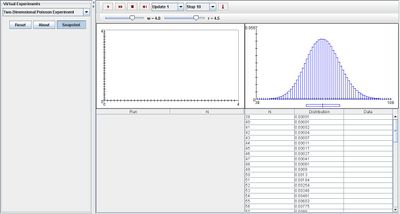
Because parameter W and r may be varied, both variables may change the two graphs of the experiment. The distribution graph in blue will become more normal when either parameter is increased. The image below displays this outcome:

Note that the empirical density and moments graph begin to converge to the distribution graph after every trial.

Applications
The Two Dimensional Poisson Experiment is an applet that generalizes the importance of experiments involving Poisson distributions. It may be used in many different types of examples:
Students may use this applet in replace of matrices when dealing with discrete mathematics.
Suppose engineers are dealing with computational fluid dynamics, then they can obtain the pressure Poisson equation by taking the divergence of all the terms in the momentum equation. This applet may be an assistance to display their findings of an incompressible flow problem where the incompressibility condition acts as a constraint for pressure.
Translate this page: