Difference between revisions of "SOCR EduMaterials Activities Discrete Distributions"
(→This is an activity to explore the Poisson Probability Distribution.) |
(→This is an activity to explore the Poisson Probability Distribution.) |
||
| Line 13: | Line 13: | ||
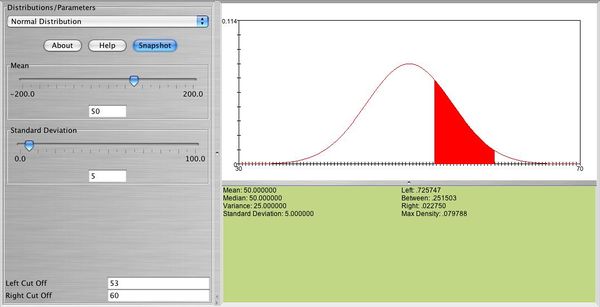
| − | Below you can see the distribution of a normal random variable <math> X </math> with <math> \mu=50, \sigma=5 </math>. In this graph you can also see the probability that <math> X </math> is between | + | Below you can see the distribution of a normal random variable <math> X </math> with <math> \mu=50, \sigma=5 </math>. In this graph you can also see the probability that <math> X </math> is between 53 and 60. |
Revision as of 23:43, 7 November 2006
This is an activity to explore the Poisson Probability Distribution.
- Description: You can access the applets for the above distributions at http://www.socr.ucla.edu/htmls/SOCR_Distributions.html .
- Exercise 1: Use SOCR to graph and print the distribution of a Poisson random variable with \( \lambda=2 \). What is the shape of this distribution?
- Exercise 2: Use SOCR to graph and print the distribution of a Poisson random variable with \( \lambda=15 \). What is the shape of this distribution? What happens when you keep increasing \( \lambda \)?
- Exercise 3: Let \( X \sim Poisson(5) \). Find \( P(3 \le X < 10) \), and \( P(X >10 | X \ge 4) \).
- Exercise 4: Poisson approximation to binomial: Graph and print \( X \sim b(60, 0.02) \). Approximate this probability distribution using Poisson. Choose three values of \( X \) and compute the probability for each one using Poisson and then using binomial. How good is the approximation?
Below you can see the distribution of a normal random variable \( X \) with \( \mu=50, \sigma=5 \). In this graph you can also see the probability that \( X \) is between 53 and 60.

- SOCR Home page: http://www.socr.ucla.edu
Translate this page:
</math>