Difference between revisions of "SOCR Data Brain2BodyWeight"
(Created page with '== SOCR Data - Brain to Body Weight Dataset == ===Data Description=== [[Image:SOCR_Data_Dinov_EnglishLetterFrequency.png|150px|thumbnail|right| [http://en.wikiped…') |
(No difference)
|
Revision as of 19:45, 16 June 2011
Contents
SOCR Data - Brain to Body Weight Dataset
Data Description
These data represent the relation between weights of the body and brain of various species. It may be used to discuss bivariate exploratory and quantitative data analyses in the case of allometric relationships. Brain-to-body weight ratio is assumed to be related to species intelligence. The encephalization quotient is a more complex measurement that takes into account allometric effects of widely divergent body sizes across several taxa. The brain-to-body mass ratio is a simpler measure of encephalization within species.
Data Table
| Species | BodyWeight(kg) | BrainWeight(kg) | Brain-to-Body-Weight_Proportion |
|---|---|---|---|
| Newborn_Human | 3.2 | 0.374984813 | 0.117182754 |
| Adult_Human | 73 | 1.349981613 | 0.018492899 |
| Pithecanthropus_Man | 70 | 0.925010921 | 0.013214442 |
| Squirrel | 0.8 | 0.007620352 | 0.00952544 |
| Hamster | 0.15 | 0.001406136 | 0.009374242 |
| Chimpanzee | 50 | 0.419981176 | 0.008399624 |
| Rabbit | 1.4 | 0.011521246 | 0.008229462 |
| Dog_(Beagle) | 10 | 0.071985109 | 0.007198511 |
| Cat | 4.5 | 0.029982456 | 0.006662768 |
| Rat | 0.4 | 0.001995806 | 0.004989516 |
| Bottle-Nosed_Dolphin | 400 | 1.49998461 | 0.003749962 |
| Beaver | 24 | 0.044996363 | 0.001874848 |
| Gorilla | 320 | 0.502489628 | 0.00157028 |
| Tiger | 170 | 0.263491808 | 0.001549952 |
| Owl | 1.5 | 0.002222603 | 0.001481735 |
| Camel | 550 | 0.761989823 | 0.001385436 |
| Elephant | 4600 | 5.999983798 | 0.001304344 |
| Lion | 187 | 0.239995723 | 0.0012834 |
| Sheep | 120 | 0.139978605 | 0.001166488 |
| Walrus | 800 | 0.925010921 | 0.001156264 |
| Horse | 450 | 0.502489628 | 0.001116644 |
| Cow | 700 | 0.441481454 | 0.000630688 |
| Giraffe | 950 | 0.532018491 | 0.000560019 |
| Green_Lizard | 0.2 | 9.07185E-05 | 0.000453592 |
| Sperm_Whale | 35000 | 7.799974401 | 0.000222856 |
| Turtle | 3 | 0.000317515 | 0.000105838 |
| Alligator | 270 | 0.008391459 | 3.10795E-05 |
Graphs
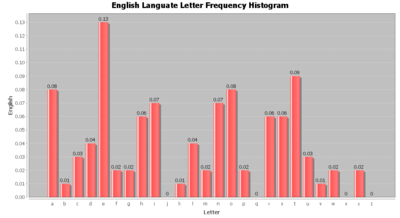
- Histogram (HistogramChartDemo7) of the English letters

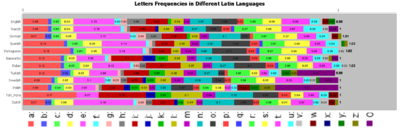
- Stacked Bar-Chart (StackedBarChartDemo3, under BarCharts --> CategoryPlots) of all letters across each language

References
- Berta, A., et al. Marine Mammals. Evolutionary Biology, San Diego: Academic Press, 1999.
- Blinkov, S.M. and Glezer, I.I. The Human Brain in Figures and Tables. A Quantitative Handbook, New York: Plenum Press, 1968.
- Demski, L.S. and Northcutt, R.G. The brain and cranial nerves of the white shark: an evolutionary perspective. In Great White Sharks. The Biology of Carcharodon carcharias, San Diego: Academic Press, 1996.
- Nieuwenhuys, R., Ten Donkelaar, H.J. and Nicholson, C. The Central Nervous System of Vertebrates. Vol. 3, Berlin: Springer, 1998.
- Mink, J.W., Blumenschine, R.J. and Adams, D.B. Ratio of central nervous system to body metabolism in vertebrates: its constancy and functional basis. Am. J. Physiology, 241:R203-R212, 1981.
- Rehkamper, G., Frahm, H.D. and Zilles, K. Quantitative development of brain and brain structures in birds (Galliformes and Passeriforms) compared to that in mammals (Insectivores and Primates). Brain Beh. Evol., 37:125-143, 1991.
- Ridgway, S.H. and Harrison, S., Handbook of Marine Mammals, Vol. 3, London: Academic Press, 1985.
- Shoshani, J., Kupsky, W.J. and Marchant, G.H., Elephant brain. Part I: Gross morphology functions, comparative anatomy, and evolution, Brain Res. Bulletin, 70:124-157, 2006.
- SOCR Home page: http://www.socr.ucla.edu
Translate this page:
