Difference between revisions of "SOCR EduMaterials AnalysisActivities NormalPower Power"
| Line 1: | Line 1: | ||
| + | '''1.''' Click on '''SELECT PARAMETERS''' to define parameter values. Note that all the fields are required, otherwise the power will not be computed. | ||
| + | |||
| + | |||
<center>[[Image:SOCR_AnalysisActivities_NormalPowerPower_Chu_051707_Fig1.gif|700px]]</center> | <center>[[Image:SOCR_AnalysisActivities_NormalPowerPower_Chu_051707_Fig1.gif|700px]]</center> | ||
| + | |||
| + | '''2.''' Click on '''CALCULATE''' to get the power. | ||
<center>[[Image:SOCR_AnalysisActivities_NormalPowerPower_Chu_051707_Fig2.gif|700px]]</center> | <center>[[Image:SOCR_AnalysisActivities_NormalPowerPower_Chu_051707_Fig2.gif|700px]]</center> | ||
| + | |||
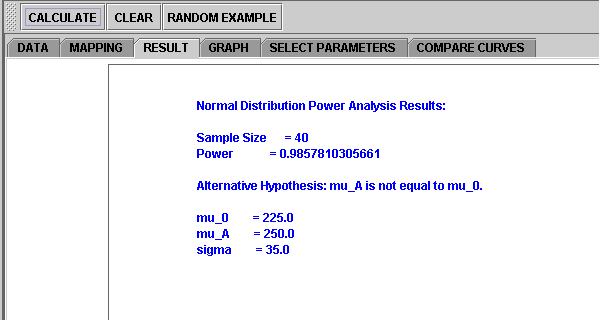
| + | '''3.''' Then click on '''RESULT''' to see the results. | ||
<center>[[Image:SOCR_AnalysisActivities_NormalPowerPower_Chu_051707_Fig3.gif|700px]]</center> | <center>[[Image:SOCR_AnalysisActivities_NormalPowerPower_Chu_051707_Fig3.gif|700px]]</center> | ||
| + | |||
| + | '''4.''' Click on '''GRAPH''' to see a function of possible values of power. | ||
<center>[[Image:SOCR_AnalysisActivities_NormalPowerPower_Chu_051707_Fig4.gif|700px]]</center> | <center>[[Image:SOCR_AnalysisActivities_NormalPowerPower_Chu_051707_Fig4.gif|700px]]</center> | ||
| + | |||
| + | '''5.''' Click on '''COMPARE CURVES''' to view distrubution of the population and the mean. | ||
<center>[[Image:SOCR_AnalysisActivities_NormalPowerPower_Chu_051707_Fig5.gif|700px]]</center> | <center>[[Image:SOCR_AnalysisActivities_NormalPowerPower_Chu_051707_Fig5.gif|700px]]</center> | ||
Revision as of 03:41, 6 August 2007
1. Click on SELECT PARAMETERS to define parameter values. Note that all the fields are required, otherwise the power will not be computed.
Error creating thumbnail: File missing
2. Click on CALCULATE to get the power.

3. Then click on RESULT to see the results.
Error creating thumbnail: File missing
4. Click on GRAPH to see a function of possible values of power.
Error creating thumbnail: File missing
5. Click on COMPARE CURVES to view distrubution of the population and the mean.