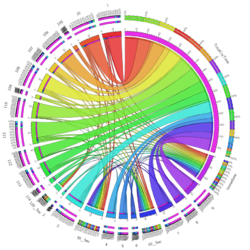
SOCR Data AD BiomedBigMetadata
Contents
SOCR Data - Modeling and Analysis of Clinical, Genetic and Imaging Data of Alzheimer’s Disease
Summary
These data include massive heterogeneous clinical, genetic and imaging data of Alzheimer’s disease.
Background
There are megabytes of health-related metadata some of which is incomplete, irrelevant or difficult to establish homologies between different variables or subjects. In this dataset, missing values are denoted by (“.”).
The goal is to interrogate the data using exploratory and quantitative data analysis methods and look for patterns, trends or relations that may provide cues to the diagnosis, cognitive state or prognosis of these subjects (patients and control). Specifically, one may investigate the following:
- Identify clusters of data that agrees with specific phenotypes (e.g., Diagnosis/Dx) or traits (e.g., NPI scores).
- Reduce the dimensionality of the data and identify linear sub-spaces that contain large between subject variations or expose common traits.
- Plan the integration of imaging biomarkers with these clinical and demographic data. The new Pipeline mechanism for Study-Designs enables the integrated analysis of imaging and meta-data (more information on the pipeline is available here).
Although SOCR Tools may be useful for some of this analysis, most of the interesting analyses may require the use of graphical Pipeline workflows, R, Matlab, C/C++/Java and other computational libraries/tools can be compiled as stand-alone execs and wrapped in XML as Pipeline modules, http://ucla.in/TI94HR). This allows openly sharing of the complete protocols (pipeline.xml.pipe files) for the entire community to replicate, revise, validate, and cite.
Classroom use of this data set
This data set can be used to illustrate (multivariate, logistic) regression analyses, non-parametric tests, classification/clustering approaches, and diverse array of exploratory data analyses.
Data Description
...
Data Table
References
- ...
- SOCR Home page: http://www.SOCR.ucla.edu
Translate this page:
